

Question: Please solve: additional info: D 17 MindTap Homework p-Charts and c-Charts Spreadsneet Data showing the number of errors per one hundred lines of code for
Please solve: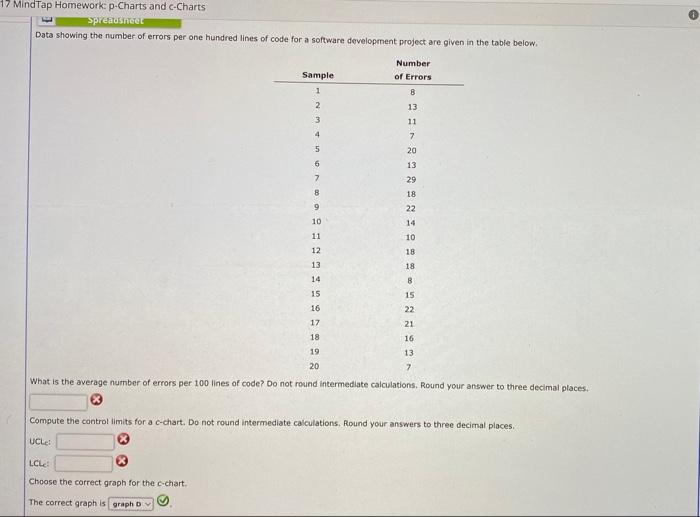
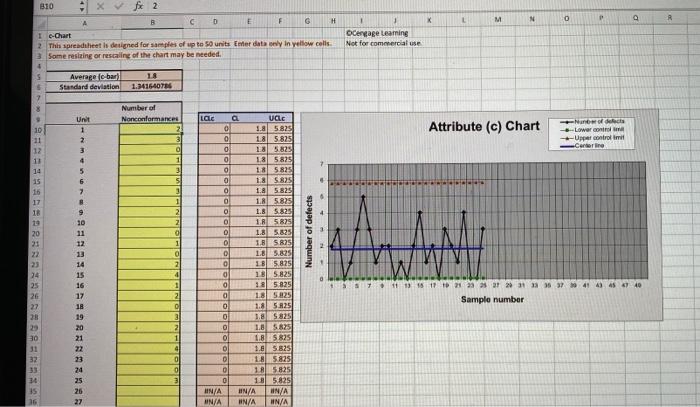
D 17 MindTap Homework p-Charts and c-Charts Spreadsneet Data showing the number of errors per one hundred lines of code for a software development project are given in the table below. Sample 1 2 Number of Errors B 13 3 11 4 7 20 5 6 13 7 29 8 9 18 22 10 14 11 10 12 18 13 18 14 8 15 15 16 22 17 21 18 16 19 13 20 7 What is the average number of errors per 100 lines of code? Do not round intermediate calculations, Round your answer to three decimal places. Compute the control limits for a c-chart. Do not round Intermediate calculations, Round your answers to three decimal places. UCLE! LCL Choose the correct graph for the c-chart. The correct graph is graph D 0 P D R Attribute (c) Chart No defects --Lower Une control Carrie B10 - Xfx2 B D E F G H 1 X M N 1 e-Chart oceryage Learning 2 This spreadsheet is designed for samples of up to 50 units Enter dat wy in yellow cells Not for commercial use 3 Some resizing or retaling of the chart may be needed 4 5 Average le ball 18 Standard deviation 1.141640785 7 3 Number of 9 Unit Nonconformances LOLE vac 10 1 22 o 1.a 5825 11 2 0 1.8 5.825 12 3 0 18 5.829 11 4 1 0 1.85R25 14 5 3 18 5825 15 6 5 0 1.8 5.825 16 7 3 o 1.2 5.825 17 1 0 1.A 5825 18 2 0 1.8 5.825 29 10 2 O 1.B 5.825 20 0 1.8 5.825 2.1 1 0 1.B 5825 22 0 0 1.8 5.825 23 14 2 0 18 5.825 15 4 0 15 5.825 16 1 0 18 5.825 +381 11 13 15 17 12 31 2016 26 17 2 0 18 5.825 18 Sample number 0 1. 5.825 28 19 3 0 5825 29 20 2 0 18 5825 1 0 15825 31 4 O 1.6 5825 32 23 0 D 18 5835 0 0 185825 34 25 0 185.825 35 26 HN/A IN/A WN/A 27 MN/A #N/A #N/A Number of defects buldu.M.A.V. 43 45 47 40 ARNARNER ggge
additional info:
Step by Step Solution
There are 3 Steps involved in it
1 Expert Approved Answer
Step: 1 Unlock

Question Has Been Solved by an Expert!
Get step-by-step solutions from verified subject matter experts
Step: 2 Unlock
Step: 3 Unlock