

Question: Please solve: Additional info: Search this cou 77 MindTap Homework: p-Charts and c-Charts Spreadsheet A mail-order prescription drug vendor measured the number of errors per
Please solve: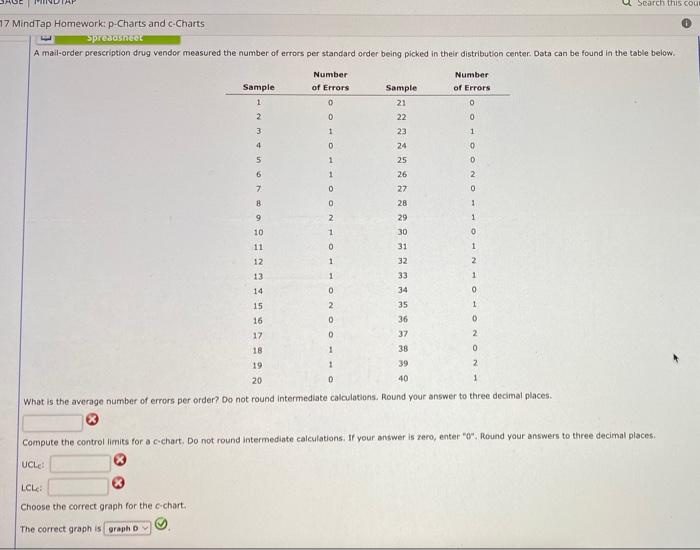
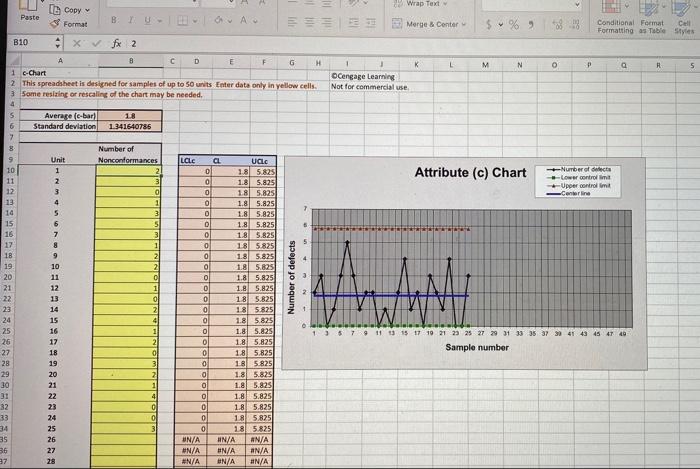
Search this cou 77 MindTap Homework: p-Charts and c-Charts Spreadsheet A mail-order prescription drug vendor measured the number of errors per standard order being picked in their distribution center. Data can be found in the table below. Number of Errors Number of Errors Sample 1 Sample 21 0 0 2 0 22 0 1 1 23 24 0 3 4 5 6 7 0 0 1 1 2 0 0 B 0 1 25 26 27 28 29 30 31 32 2 1 1 RASSERS 9 10 11 12 0 1 0 1 2 13 1 33 1 14 0 0 2. 1 0 0 15 16 17 18 D 34 35 36 37 38 39 40 2 1 0 19 1 2 1 20 0 What is the average number of errors per order? Do not round Intermediate calculations. Round your answer to three decimal places 8 $ zero, enter"0" Round your answers to three decimal places Compute the control limits for a c-chart. Do not round Intermediate calculations. If your answer UCLE: LCL: Choose the correct graph for the c-chart. The correct graph is graph D Wrap Text Paste Copy v Format BU- o A. ==== Merge & Center Conditional Format Cell Formatting as Table Styles B10 Xfx 2 R 5 Unit Lale Attribute (c) Chart B D E F G H K L M N O P a 1 c-Chart Cengage Learning 2 This spreadsheet is designed for samples of up to 50 units Enter data only in yellow cells. Not for commercial use 3 Some resizing or rescaling of the chart may be needed. 4 5 Average (c-bar) 18 6 Standard deviation 1341640785 7 Number of 9 Nonconformances a UCLC 10 1 2 0 18 5.825 Number of colecta 2 3 0 1.8 5.825 -Lower control -Upper control 3 0 0 1.8 5.825 Centerline 4 1 0 1.8 5.825 3 0 1.8 5.825 0 1.8 5.825 7 3 0 1.8 5.825 11 0 18 5.825 9 2 0 1.8 5.825 10 2 ol 1.8 5.825 11 ol 0 1.8 5.825 53 21 12 1 0 1.8 5.825 13 0 18 5.825 14 2 o 18 5.8251 1 24 15 4 1.8 5.825 25 16 1 0 1.8 5.825 1 3 5 7 9 11 13 15 17 19 21 23 25 27 29 31 35 36 37 39 41 43 45 47 49 26 17 2 1.8 5.825 27 18 Sample number 0 0 18 5 825 28 19 3 0 18 5.825 29 20 2 0 1.8 5.825 30 21 1 0 1.8) 5.825 31 22 4 0 1.8 5.825 23 0 0 1.8 5.825 33 24 0 0 18 5.825 34 25 3 0 18! 5.825 35 26 UN/A #N/A AN/A 36 27 #N/A #N/A AN/A 37 28 #N/A EN/A #N/A Number of defects WMV "mummnu Additional info:
Step by Step Solution
There are 3 Steps involved in it
1 Expert Approved Answer
Step: 1 Unlock

Question Has Been Solved by an Expert!
Get step-by-step solutions from verified subject matter experts
Step: 2 Unlock
Step: 3 Unlock