

Question: please solve all 4 questions Remember, the expected value of a probability distribution is a statistical measure of the average (mean) value expected to occur
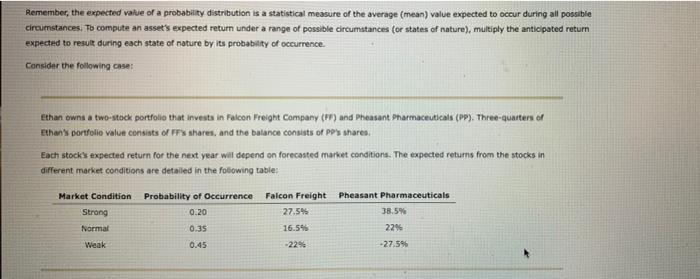
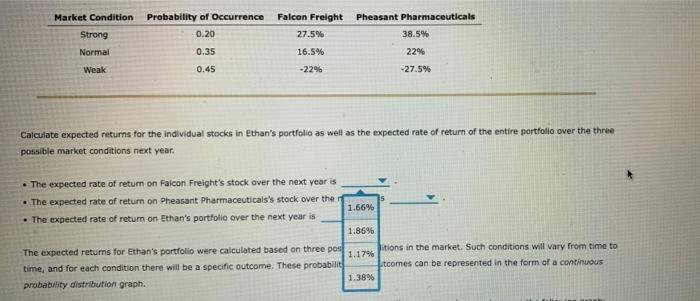
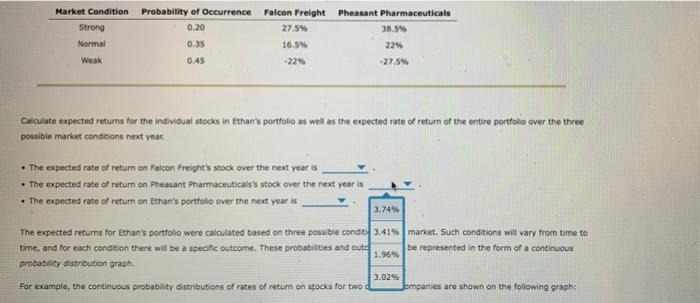
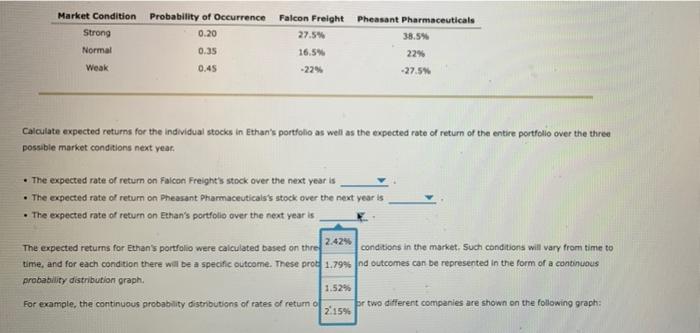
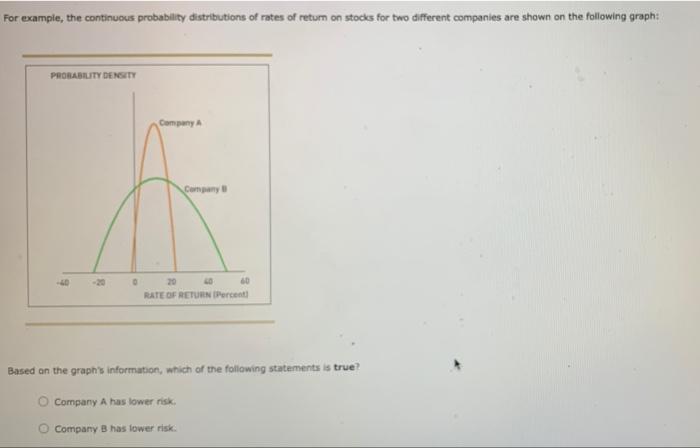
Remember, the expected value of a probability distribution is a statistical measure of the average (mean) value expected to occur during all possible circumstances. To compute an asset's expected return under a range of possible circumstances (or states of nature), multiply the anticipated return expected to result during each state of nature by its probability of occurrence. Consider the following cose Ethan owns a two-stock portfolio that invests in Falcon Freight Company (FF) and Pheasant Pharmaceuticals (PP). Three-quarters of Ethan's portfolio value consists of FFX shares, and the balance consists of PP's shares Each stocks expected return for the next year wil depend on forecasted market conditions. The expected returns from the stocks in different market conditions are detailed in the following table: Market Condition Probability of Occurrence Falcon Freight Pheasant Pharmaceuticals Strong 0.20 27.59 38.5% Normal 16.54 -27.59 0.35 22% Weak 0.45 -22 Market Condition Pheasant Pharmaceuticals Probability of Occurrence 0.20 0.35 Falcon Freight 27.5% Strong Normal Weak 38.5% 22% 16.5% -22% 0.45 -27.5% Calculate expected returns for the individual stocks in Ethan's portfolio as well as the expected rate of return of the entire portfolio over the three possible market conditions next year. The expected rate of return on Falcon Freight's stock over the next year is The expected rate of return on Pheasant Pharmaceuticals's stock over the 1.66% . The expected rate of return on Ethan's portfolio over the next year is 1.86% The expected returns for Ethan's portfolio were calculated based on three pos itions in the market. Such conditions will vary from time to 1.17% time, and for each condition there will be a specific outcome. These probabilit utcomes can be represented in the form of a continuous probability distribution graph. 1.38% Market Condition Strong Normal Weak Probability of Occurrence Falcon Freight Pheasant Pharmaceuticals 0.20 27.5% 38.5% 0.35 16.5% 229 0.45 -22% -27.5W Calculate expected returns for the individual stocks in Ethan's portfolio as well as the expected rate of return of the entire portfolio over the three possible market conditions next year. The expected rate of return on Falcon Freight's stock over the next year is The expected rate of return on Pheasant Pharmaceutically stock over the next year is . The expected rate of return on Ethan's portfolio over the next year is 3.74% The expected returns for ethan's portfolio were calculated based on three possible condit. 3.41% market. Such conditions will vary from time to time, and for each condition there will be a specific outcome. These probabilities and outd 1.96% be represented in the form of a continuous probability distribution graph. 3.029 For example, the continuous probability distributions of rates of return on stocks for two Jompanies are shown on the following graph: Market Condition Probability of Occurrence Strong 0.20 Normal 0.35 Falcon Freight Pheasant Pharmaceuticals 27.5% 38.5% 16.5% 22% -22% -27.5% Weak 0.45 Calculate expected returns for the individual stocks in Ethan's portfolio as well as the expected rate of return of the entire portfolio over the three possible market conditions next year. The expected rate of return on Falcon Freight's stock over the next year is . The expected rate of return on Pheasant Pharmaceuticals's stock over the next year is The expected rate of return on Ethan's portfolio over the next year is 2.42% The expected returns for Ethan's portfolio were calculated based on the conditions in the market. Such conditions will vary from time to time, and for each condition there will be a specific outcome. These prod 1.79% Ind outcomes can be represented in the form of a continuous probability distribution graph. 1.52% For example, the continuous probability distributions of rates of return of 2.15% br two different companies are shown on the following graph: For example, the continuous probability distributions of rates of retum on stocks for two different companies are shown on the following graph: PROBABILITY DENSITY Company Company LO 60 RATE OF RETURN Percent Based on the graph's information, which of the following statements is true? Company A has lower risk Company B has lower risk
Step by Step Solution
There are 3 Steps involved in it

Get step-by-step solutions from verified subject matter experts