

Question: please solve all (Multi-choice) The production schedule that minimizes the total cost to meet the forecasted demand is listed in the above sheet. The list
please solve all (Multi-choice)
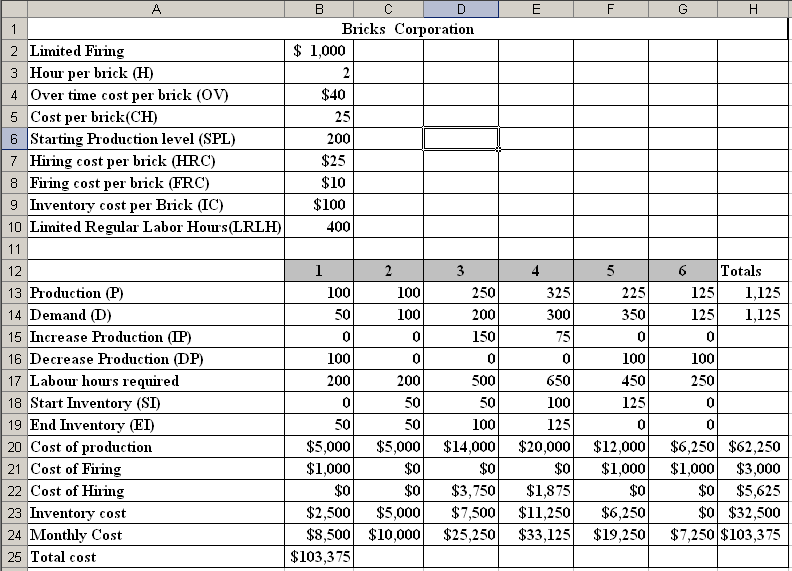
- The production schedule that minimizes the total cost to meet the forecasted demand is listed in the above sheet. The list of constraints used in the solver are all of the following except:
- The monthly starting inventory must be greater than or equal to Zero.
- The ending inventory of the last month must be Zero.
- Number of fired must be
- Monthly Production >= Starting Production Level
- To calculate the monthly increase production, the following formula is used for the first month,
- If (Demand Production, production - increase production,0)
- If (Demand >0, 0, production Starting Production Level)
- If (Max (Decrease production, increase production) >0, Production - Starting Production Level,0)
- None of the above.
- To calculate the monthly End Inventory, the following formula is used:
- Average (Start inventory, end Inventory, Production) - Demand
- Average (Decrease production, increase production, Start inventory, end Inventory) Demand
- Start inventory + Production + end Inventory (of the previous month)- Demand
- None of the above.
- The company is considering introducing an overtime strategy, if the straight labor hours are more than 400 than an overtime cost of $40 per hour occurs. The first month overtime cost can be calculated using the following model:
- If (Production
- If (Labor hours required
- If (Labor hours required
- None of the above.
- Which model of the following has been used to calculate the Inventory cost:
- Average inventory * hours* Inventory Cost
- (Start inventory + End inventory) * hours* Inventory Cost
- Average (Start inventory + end inventory) * inventory cost
- None of the above.
- Which ones are forecasting techniques?
- regression analysis
- Delphi
- time-series models
- all of the above
- 2. One of the following methods is a causal forecasting model. Which one?
- exponential smoothing
- regression analysis
- Delphi model
- sales force composite
- Trend projection is an example of
- Delphi process.
- time series.
- causal methods.
- regression analysis.
- Which of the following provide a solution for the following LP problem?
MAX: 3X1 +4X2
Subject to:
X1 12
X2 10
4X1 _ 6X2 72
X1, X2 0
- X1 = 12, X2 = 3
- X1= 18, X2=0
- PROFIT = 54
- PROFIT= 56
- In exponential smoothing, if you wish to give a significant weight to the most recent observations, then the smoothing constant should be
- close to 0.
- close to 1.
- close to 0.5.
- less than the error.
- Which among the following is an example of quadratic function?
- 2 + (10 * X)
- (3+4) *(4*X)
- 24 + (56 X2)
- (5.3 X2) + ( 21.6 X3)
- Which among the following is not true in learning curve?
- The learning curve in some cases illustrate how the cost per unit of output decreases over time as the result of accumulated workforce learning and experience
- The learning curve express the relationship between experience and efficiency.
- As individuals and/or organizations get more experienced at a task, they usually become more efficient at them.
- All of the above
- Which among the following refers to chase method?
- Stable output rates and workforce
- Worker levels and production output are stable
- The cost of adjusting output rates and/or workforce levels
- Tends to be the preferred strategy of many organizations, including labor unions.
- The firm should choose promotion and advertising in order to increase demand when:
- The capacity and the demand are nearly equal
- The capacity is greater than the demand
- The capacity is less than the demand
- None of the above
- Which among the following is a problem that can be solved using the graphical method?
- 34P + 4T 3R = 200
- 14M + 20 N = 300
- R - E = 300 + G
- R - (FC+VC) =300
- If a company has discovered that at a price of $50, their sales volume will be 800 units. If they changed their price by $2, their sales will either increase of decrease by 50 units. Which among the following is a correct model of their price vs sales volume relationship?
- SALES VOLUME=400-50 * (PRICE-50)
- SALES VOLUME=800-50 * (PRICE-50)
- SALES VOLUME=800-25 * (PRICE-50)
- SALES VOLUME=800-25 * (PRICE-25)
Step by Step Solution
There are 3 Steps involved in it
1 Expert Approved Answer
Step: 1 Unlock

Question Has Been Solved by an Expert!
Get step-by-step solutions from verified subject matter experts
Step: 2 Unlock
Step: 3 Unlock