

Question: Please solve all the questions. They all are the same part of one single question. Kao Corporation is a Japanese toiletries and household products group.
Please solve all the questions. They all are the same part of one single question.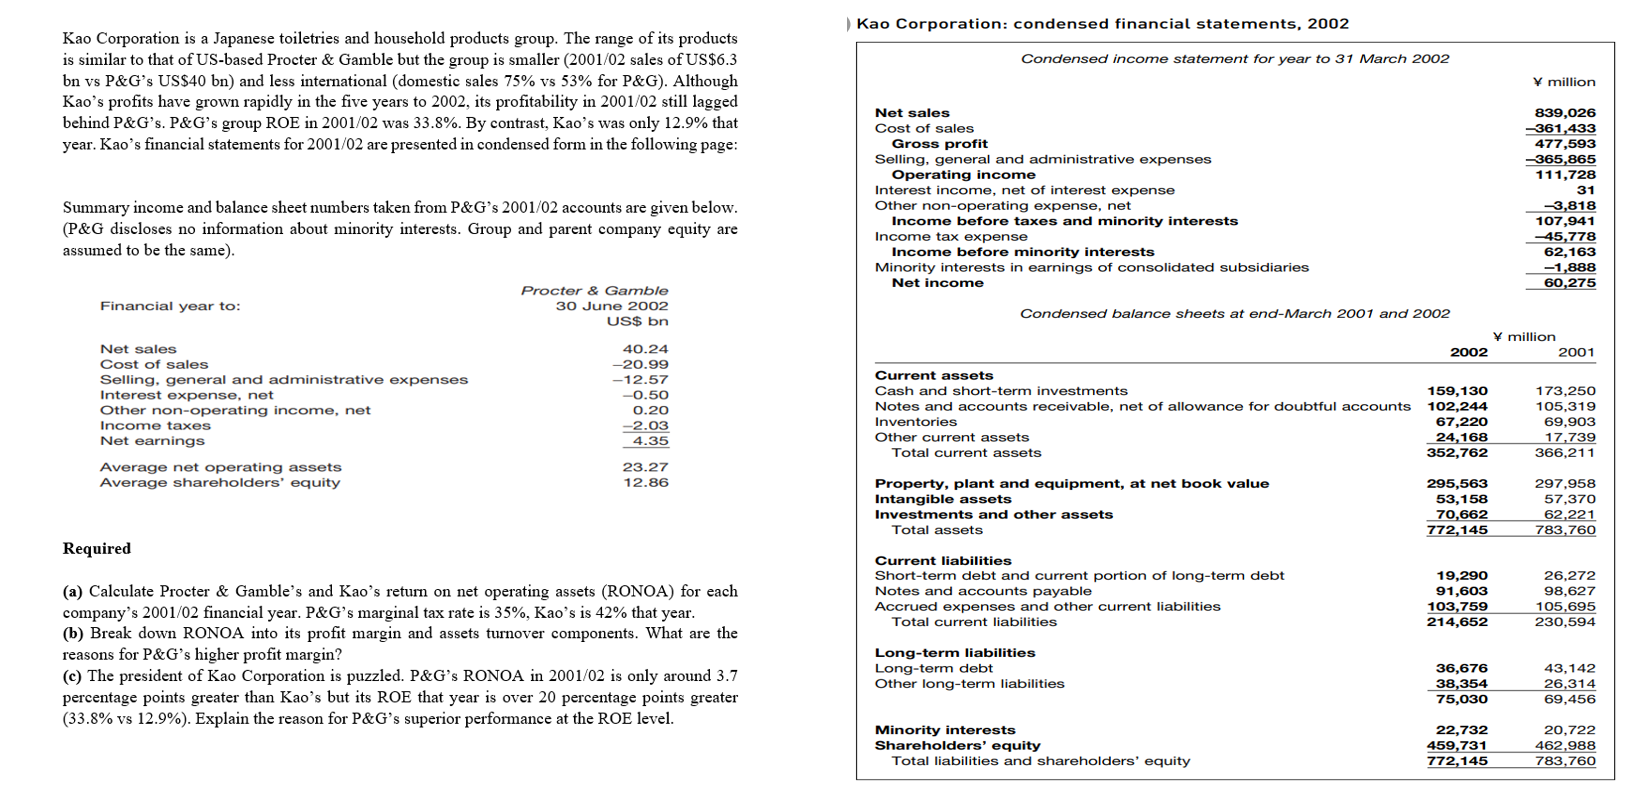
Kao Corporation is a Japanese toiletries and household products group. The range of its products is similar to that of US-based Procter & Gamble but the group is smaller (2001/02 sales of US$6.3 bn vs P&G's US$40 bn) and less international (domestic sales 75% vs 53% for P&G). Although Kao's profits have grown rapidly in the five years to 2002, its profitability in 2001/02 still lagged behind P&G's. P&G's group ROE in 2001/02 was 33.8%. By contrast, Kao's was only 12.9% that year. Kao's financial statements for 2001/02 are presented in condensed form in the following page: Summary income and balance sheet numbers taken from P&G's 2001/02 accounts are given below. (P&G discloses no information about minority interests. Group and parent company equity are assumed to be the same). Procter & Gamble Financial year to: 30 June 2002 US$ bn Net sales 40.24 Cost of sales -20.99 Selling, general and administrative expenses -12.57 -0.50 Interest expense, net Other non-operating income, net 0.20 Income taxes -2.03 4.35 Net earnings Average net operating assets 23.27 12.86 Average shareholders' equity Required (a) Calculate Procter & Gamble's and Kao's return on net operating assets (RONOA) for each company's 2001/02 financial year. P&G's marginal tax rate is 35%, Kao's is 42% that year. (b) Break down RONOA into its profit margin and assets turnover components. What are the reasons for P&G's higher profit margin? (c) The president of Kao Corporation is puzzled. P&G's RONOA in 2001/02 is only around 3.7 percentage points greater than Kao's but its ROE that year is over 20 percentage points greater (33.8% vs 12.9%). Explain the reason for P&G's superior performance at the ROE level. ) Kao Corporation: condensed financial statements, 2002 Condensed income statement for year to 31 March 2002 Net sales Cost of sales Gross profit Selling, general and administrative expenses Operating income Interest income, net of interest expense Other non-operating expense, net Income before taxes and minority interests Income tax expense Income before minority interests Minority interests in earnings of consolidated subsidiaries Net income Condensed balance sheets at end-March 2001 and 2002 2002 Current assets Cash and short-term investments 159,130 102,244 Notes and accounts receivable, net of allowance for doubtful accounts Inventories 67,220 Other current assets 24,168 352,762 Total current assets Property, plant and equipment, at net book value Intangible assets 295,563 53,158 70,662 Investments and other assets Total assets 772,145 Current liabilities 19,290 Short-term debt and current portion of long-term debt Notes and accounts payable Accrued expenses and other current liabilities Total current liabilities 91,603 103,759 214,652 Long-term liabilities Long-term debt Other long-term liabilities 36,676 38,354 75,030 22,732 Minority interests Shareholders' equity 459,731 Total liabilities and shareholders' equity 772,145 million 839,026 -361,433 477,593 -365,865 111,728 31 -3,818 107,941 -45,778 62,163 -1,888 60,275 2001 173,250 105,319 69,903 17,739 366,211 297,958 57,370 62,221 783,760 26,272 98,627 105,695 230,594 43,142 26,314 69,456 20,722 462,988 783,760 Y million Kao Corporation is a Japanese toiletries and household products group. The range of its products is similar to that of US-based Procter & Gamble but the group is smaller (2001/02 sales of US$6.3 bn vs P&G's US$40 bn) and less international (domestic sales 75% vs 53% for P&G). Although Kao's profits have grown rapidly in the five years to 2002, its profitability in 2001/02 still lagged behind P&G's. P&G's group ROE in 2001/02 was 33.8%. By contrast, Kao's was only 12.9% that year. Kao's financial statements for 2001/02 are presented in condensed form in the following page: Summary income and balance sheet numbers taken from P&G's 2001/02 accounts are given below. (P&G discloses no information about minority interests. Group and parent company equity are assumed to be the same). Procter & Gamble Financial year to: 30 June 2002 US$ bn Net sales 40.24 Cost of sales -20.99 Selling, general and administrative expenses -12.57 -0.50 Interest expense, net Other non-operating income, net 0.20 Income taxes -2.03 4.35 Net earnings Average net operating assets 23.27 12.86 Average shareholders' equity Required (a) Calculate Procter & Gamble's and Kao's return on net operating assets (RONOA) for each company's 2001/02 financial year. P&G's marginal tax rate is 35%, Kao's is 42% that year. (b) Break down RONOA into its profit margin and assets turnover components. What are the reasons for P&G's higher profit margin? (c) The president of Kao Corporation is puzzled. P&G's RONOA in 2001/02 is only around 3.7 percentage points greater than Kao's but its ROE that year is over 20 percentage points greater (33.8% vs 12.9%). Explain the reason for P&G's superior performance at the ROE level. ) Kao Corporation: condensed financial statements, 2002 Condensed income statement for year to 31 March 2002 Net sales Cost of sales Gross profit Selling, general and administrative expenses Operating income Interest income, net of interest expense Other non-operating expense, net Income before taxes and minority interests Income tax expense Income before minority interests Minority interests in earnings of consolidated subsidiaries Net income Condensed balance sheets at end-March 2001 and 2002 2002 Current assets Cash and short-term investments 159,130 102,244 Notes and accounts receivable, net of allowance for doubtful accounts Inventories 67,220 Other current assets 24,168 352,762 Total current assets Property, plant and equipment, at net book value Intangible assets 295,563 53,158 70,662 Investments and other assets Total assets 772,145 Current liabilities 19,290 Short-term debt and current portion of long-term debt Notes and accounts payable Accrued expenses and other current liabilities Total current liabilities 91,603 103,759 214,652 Long-term liabilities Long-term debt Other long-term liabilities 36,676 38,354 75,030 22,732 Minority interests Shareholders' equity 459,731 Total liabilities and shareholders' equity 772,145 million 839,026 -361,433 477,593 -365,865 111,728 31 -3,818 107,941 -45,778 62,163 -1,888 60,275 2001 173,250 105,319 69,903 17,739 366,211 297,958 57,370 62,221 783,760 26,272 98,627 105,695 230,594 43,142 26,314 69,456 20,722 462,988 783,760 Y million
Step by Step Solution
There are 3 Steps involved in it

Get step-by-step solutions from verified subject matter experts