

Question: PLEASE SOLVE ALL WITHOUT EXPLANATION JUST TYPE YOUR ANAWER (mathlab) 1. 2. 3. 4. If we use a vector t of increment /50 from the
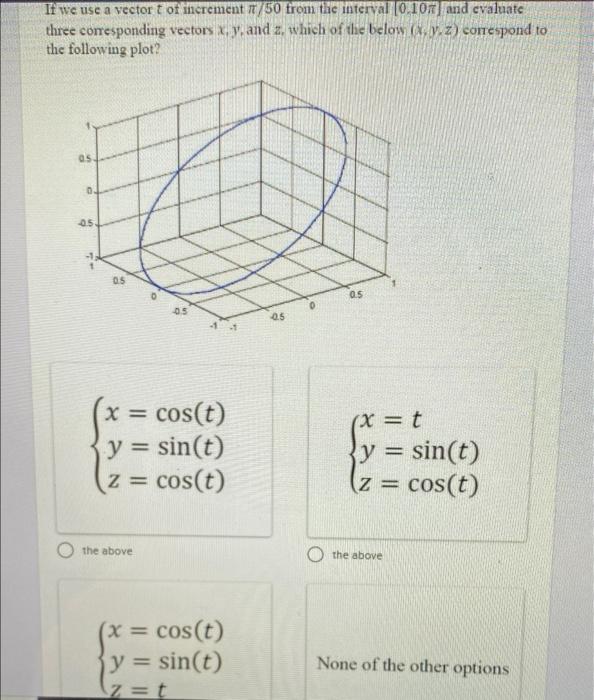
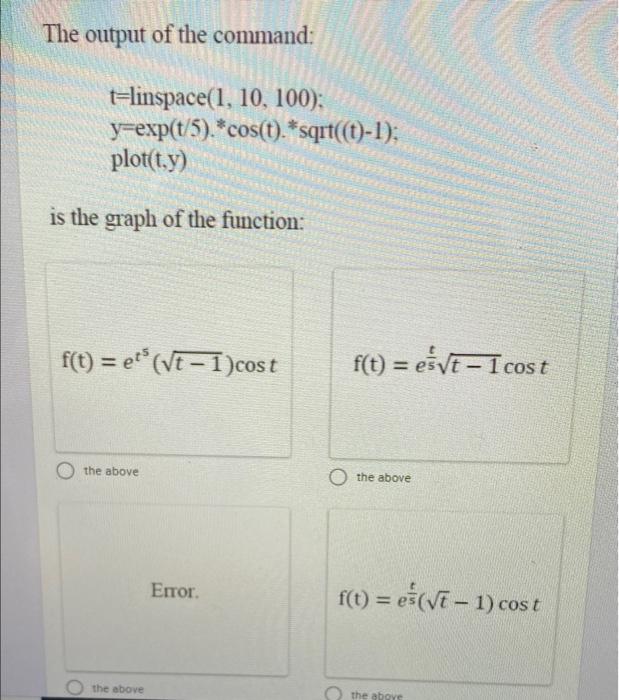

If we use a vector t of increment /50 from the interval (0.1077 and evaluate three corresponding vectors x,y, and z, which of the below (.V.z) correspond to the following plot? as 0 05 05 0 as 05 05 X = = cos(t) y = sin(t) z = cos(t) x = 0 y = sin(t) z = cos(t) the above the above X= (x = cos(t) y = sin(t) z=t None of the other options The output of the command: t=linspace(1, 10, 100); y=exp(t/5).*cos(t). *sqrt(t)-1); plot(t,y) is the graph of the function: f(t) = e(vt - 1)cost f(t) = eve - 1 cost the above the above Error f(t) = e(vt - 1) cost the above the above A. What does the following code do? p=1: for i=1:3 s=0; j=1; while j
Step by Step Solution
There are 3 Steps involved in it

Get step-by-step solutions from verified subject matter experts