

Question: Please solve and interpret The following table represents the numbers of employees, by age group, who were promoted, or not promoted, in a sample drawn
Please solve and interpret
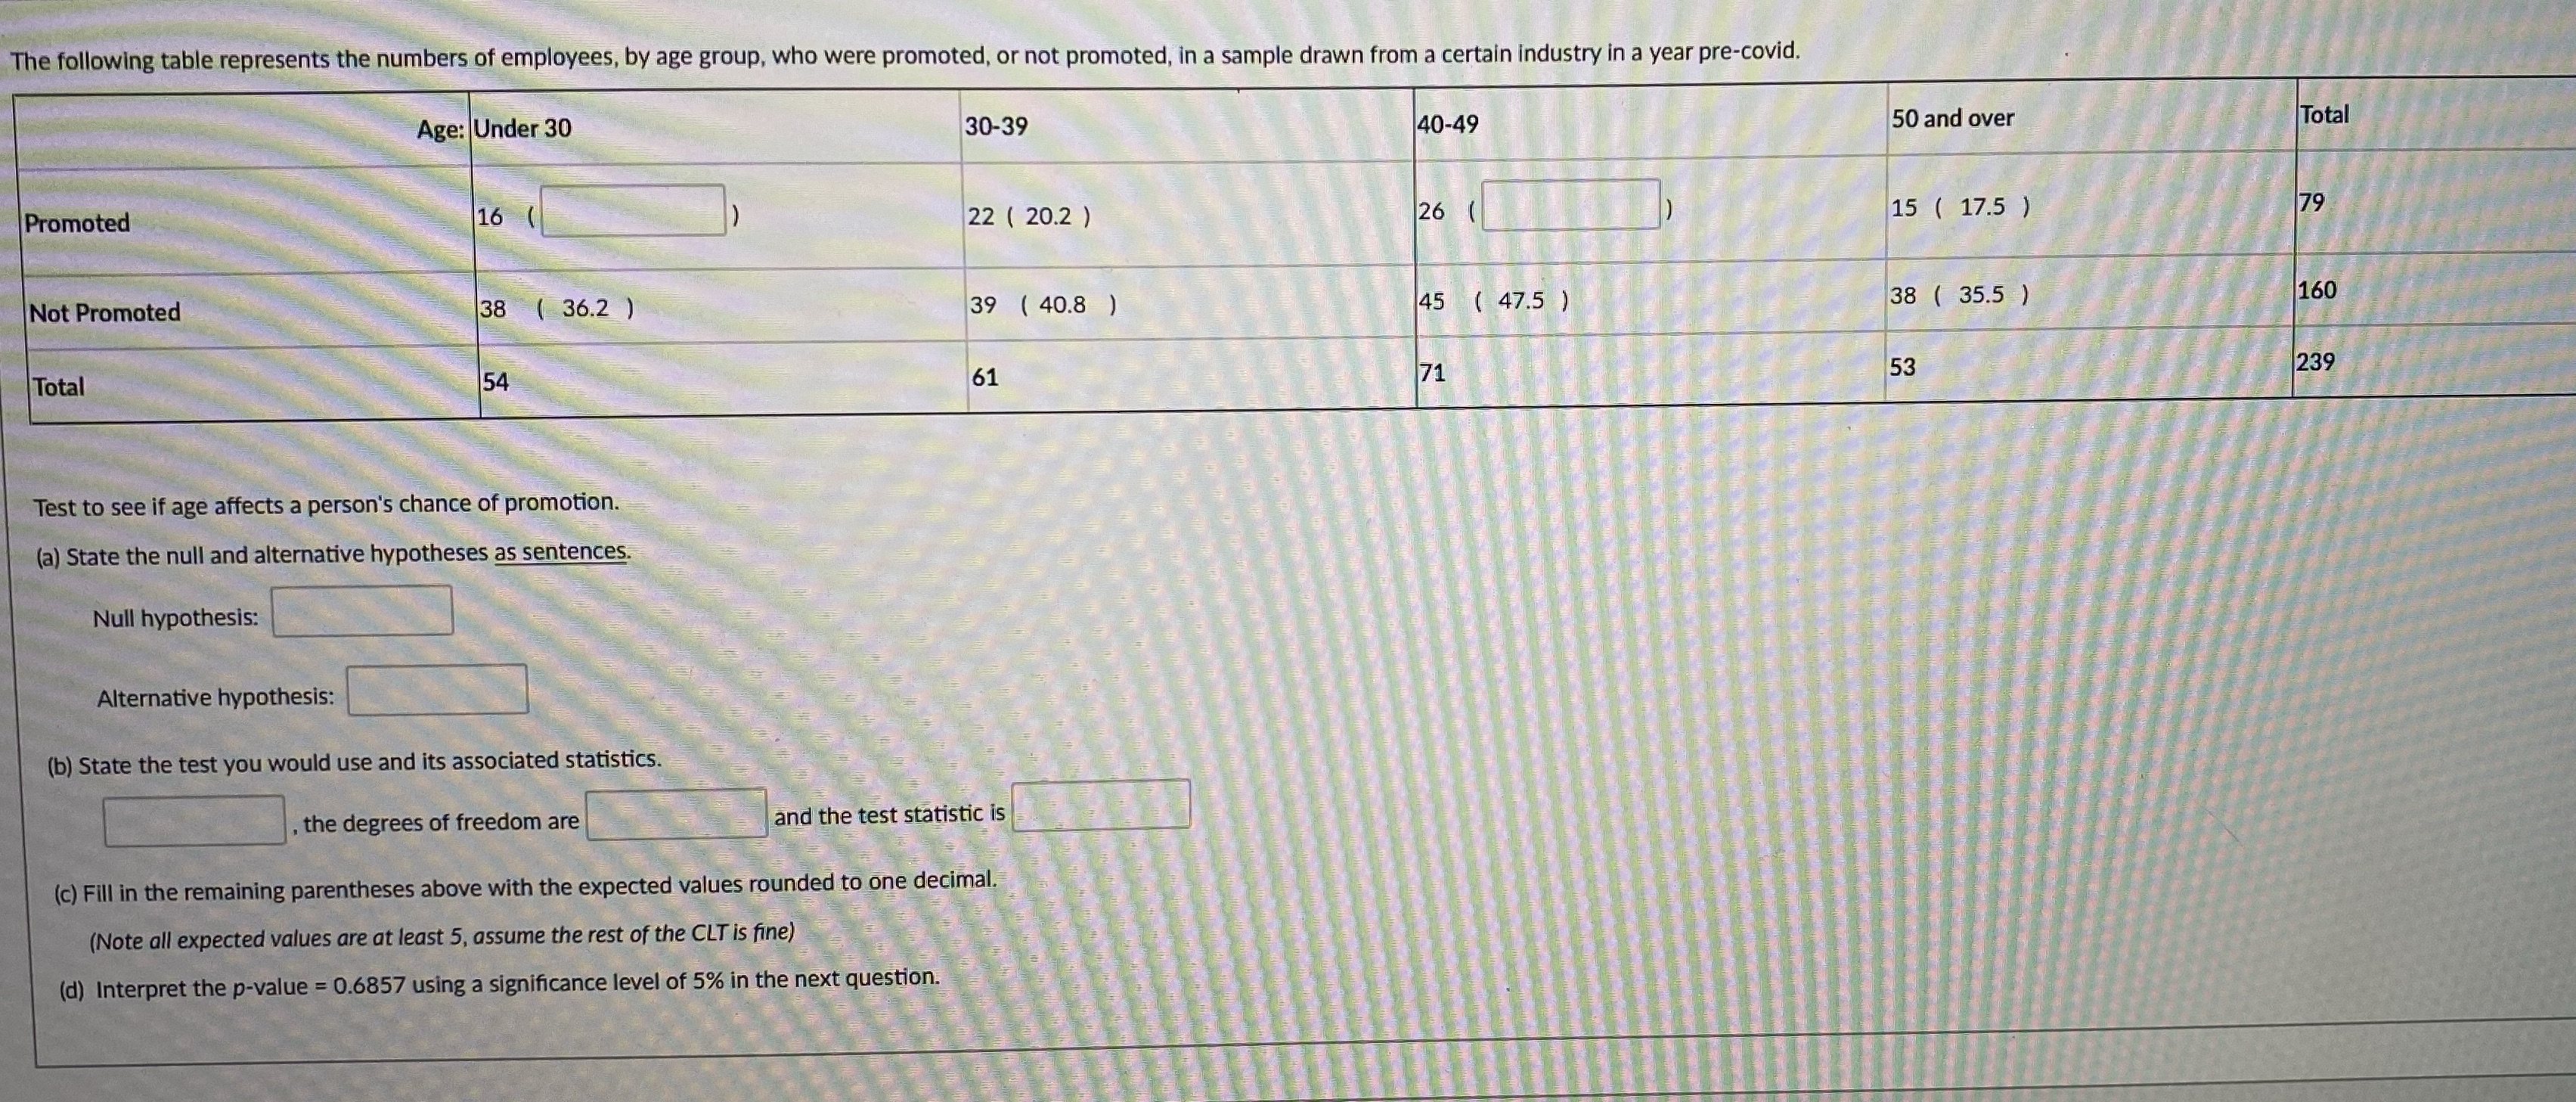
The following table represents the numbers of employees, by age group, who were promoted, or not promoted, in a sample drawn from a certain industry in a year pre-covid. Age: Under 30 30-39 40-49 50 and over Total Promoted 16 22 ( 20.2 ) 26 15 ( 17.5 ) 79 Not Promoted 38 ( 36.2 ) 39 ( 40.8 ) 45 ( 47.5 ) 38 ( 35.5 ) 160 Total 54 61 71 53 239 Test to see if age affects a person's chance of promotion. (a) State the null and alternative hypotheses as sentences. Null hypothesis: Alternative hypothesis: (b) State the test you would use and its associated statistics. , the degrees of freedom are and the test statistic is (c) Fill in the remaining parentheses above with the expected values rounded to one decimal. (Note all expected values are at least 5, assume the rest of the CLT is fine) (d) Interpret the p-value = 0.6857 using a significance level of 5% in the next
Step by Step Solution
There are 3 Steps involved in it

Get step-by-step solutions from verified subject matter experts