

Question: Please solve as it there were no multiple choice options or available graphing calculators. (: Use a graphing calculator to plot the data and find
Please solve as it there were no multiple choice options or available graphing calculators. (:

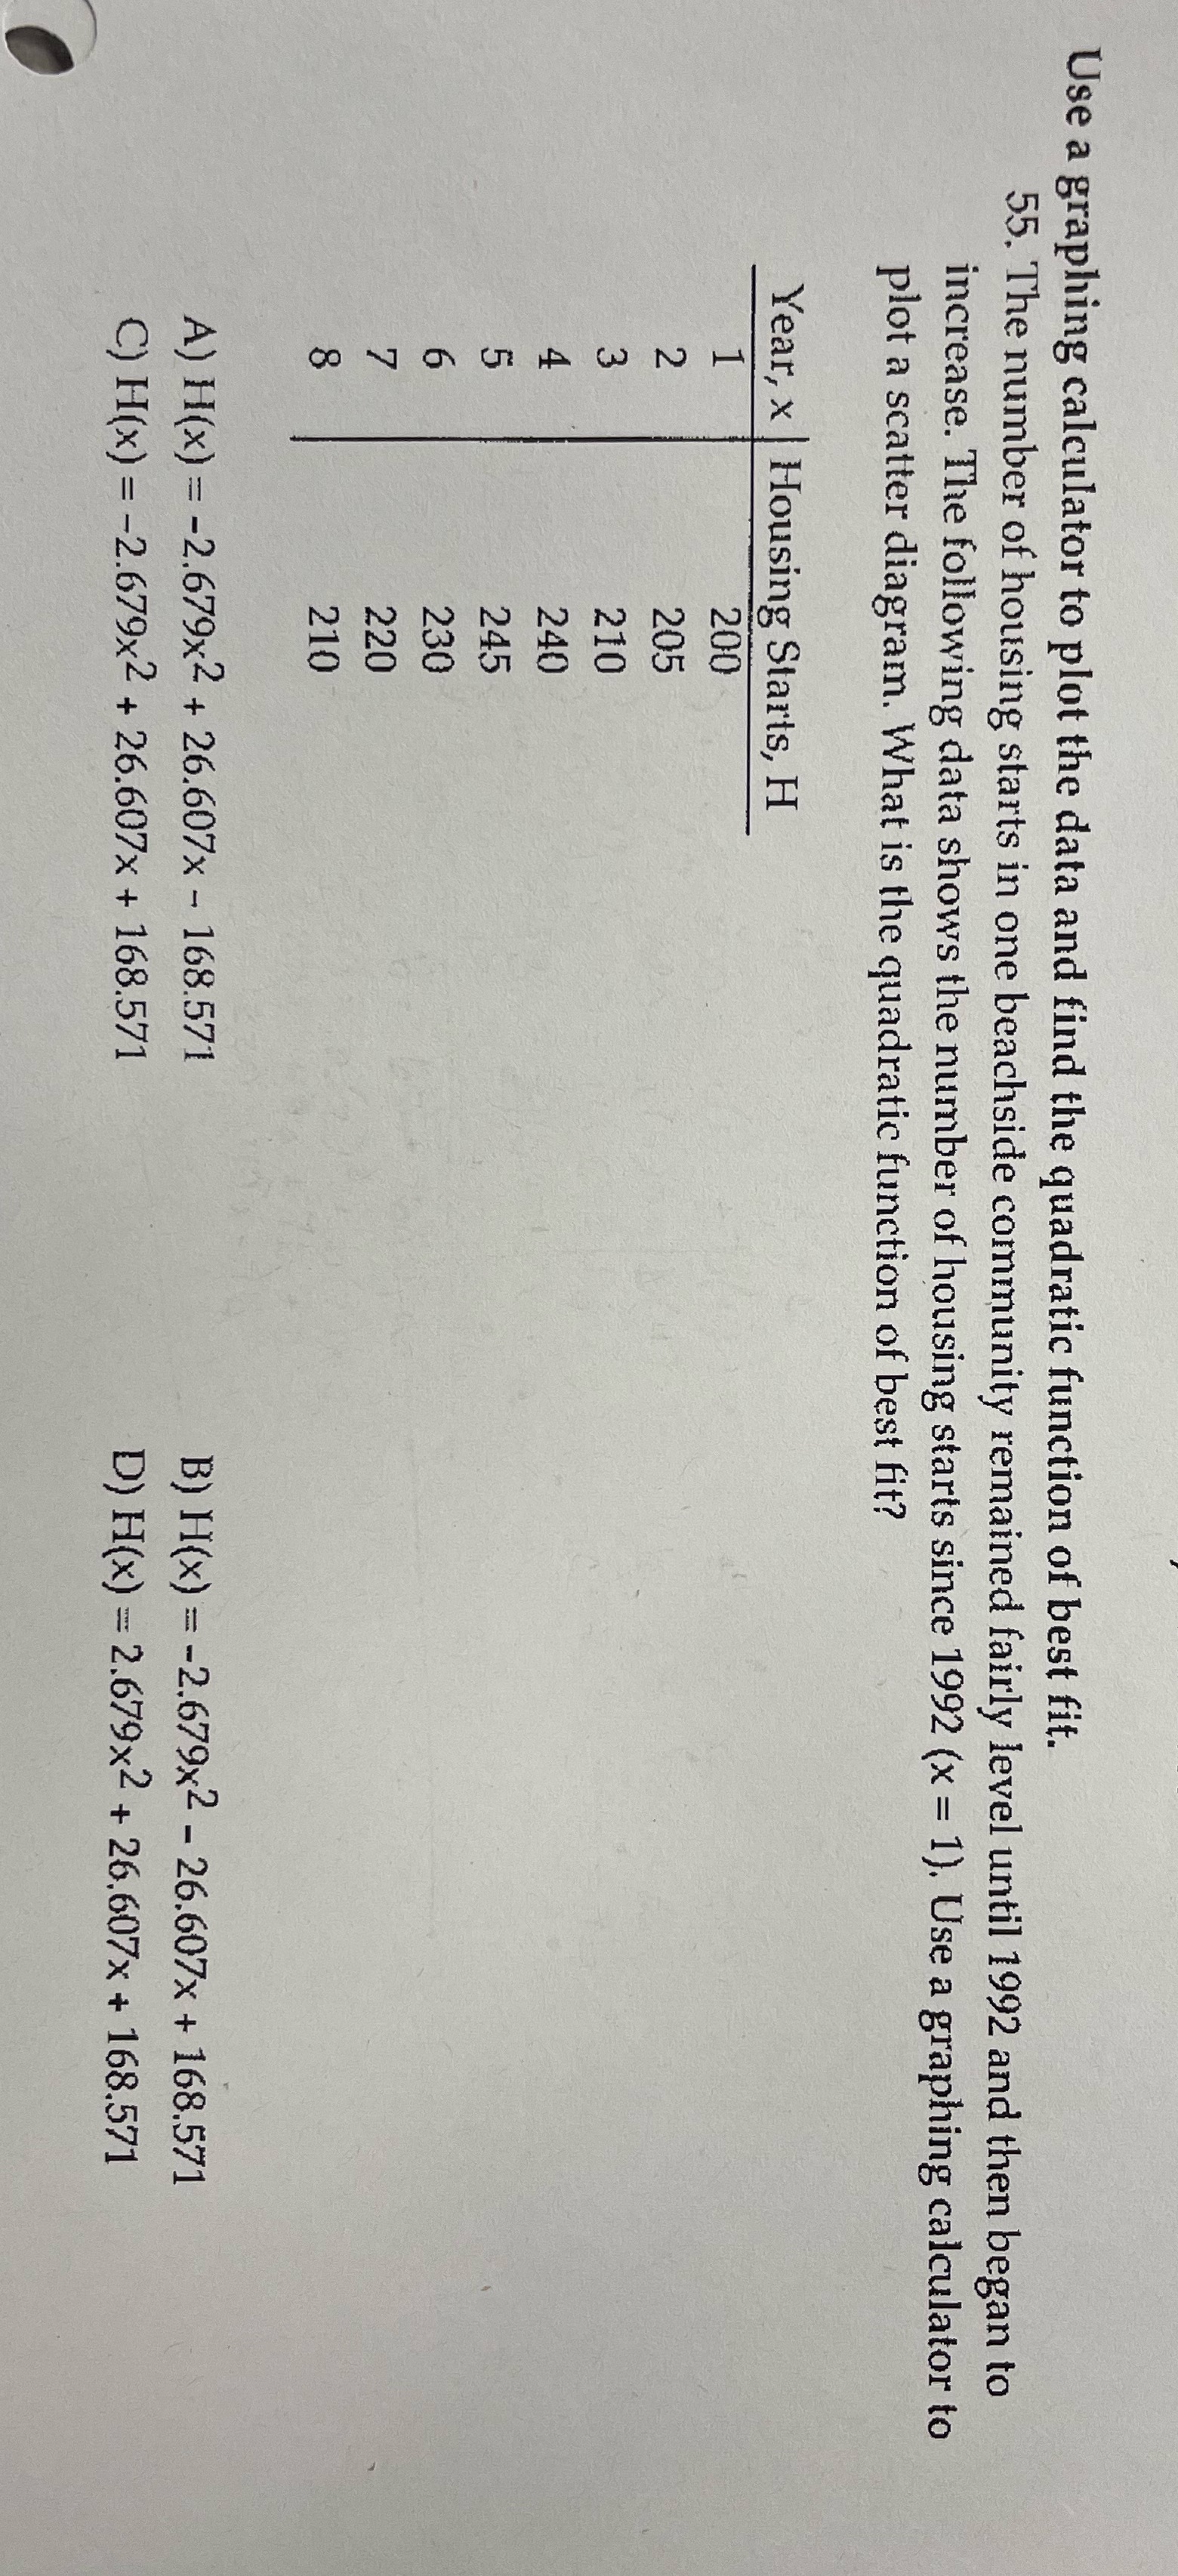
Use a graphing calculator to plot the data and find the quadratic function of best fit. 55. The number of housing starts in one beachside community remained fairly level until 1992 and then began to increase. The following data shows the number of housing starts since 1992 (x = 1). Use a graphing calculator to plot a scatter diagram. What is the quadratic function of best fit? Year, x | Housing Starts, H 200 205 210 240 245 230 220 210 A) H(x) = -2.679x2 + 26.607x - 168.571 B) H(x) = -2.679x2 - 26.607x + 168.571 C) H(x) = -2.679x2 + 26.607x + 168.571 D) H(x) = 2.679x2 + 26.607x + 168.571
Step by Step Solution
There are 3 Steps involved in it

Get step-by-step solutions from verified subject matter experts