

Question: please solve Boxplots . Consider the exam scores below for each of the three classes of students. Class A 50 50 50 63 70 70
please solve
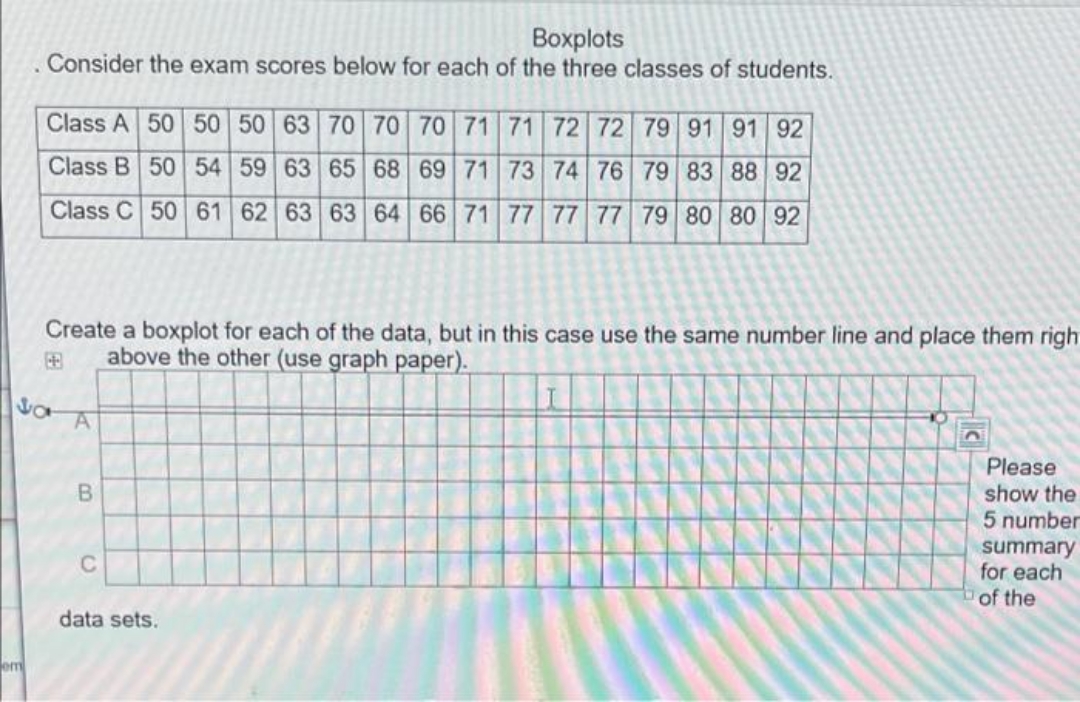
Boxplots . Consider the exam scores below for each of the three classes of students. Class A 50 50 50 63 70 70 70 71 71 72 72 79 91 91 92 Class B 50 54 59 63 65 68 69 71 73 74 76 79 83 88 92 Class C 50 61 62 63 63 64 66 71 77 77 177 79 80 80 92 Create a boxplot for each of the data, but in this case use the same number line and place them right above the other (use graph paper). A Please B show the 5 number summary C for each of the data sets. em
Step by Step Solution
There are 3 Steps involved in it
1 Expert Approved Answer
Step: 1 Unlock

Question Has Been Solved by an Expert!
Get step-by-step solutions from verified subject matter experts
Step: 2 Unlock
Step: 3 Unlock