

Question: Please solve C The following data values represent the number of homeruns a baseball player hit each year during his 25 -year baseball career. Complete
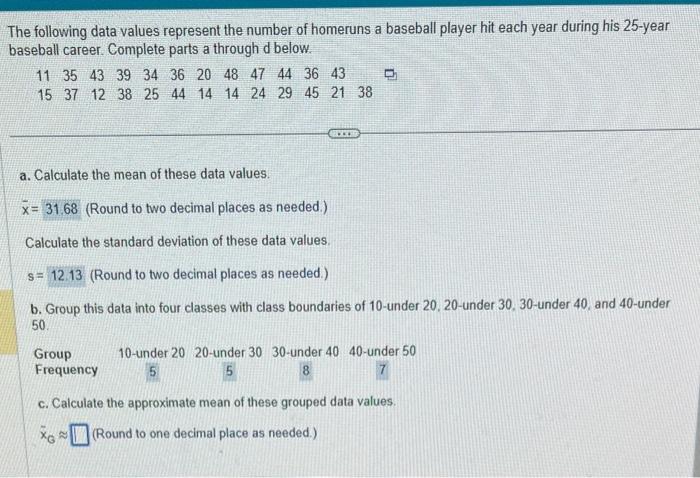
The following data values represent the number of homeruns a baseball player hit each year during his 25 -year baseball career. Complete parts a through d below. a. Calculate the mean of these data values. x=31.68 (Round to two decimal places as needed.) Calculate the standard deviation of these data values. s= (Round to two decimal places as needed.) b. Group this data into four classes with class boundaries of 10 -under 20,20 -under 30,30 -under 40 , and 40 -under 50. Group 10-under 2020-under 3030-under 4040-under 50 Frequency c. Calculate the approximate mean of these grouped data values. xG (Round to one decimal place as needed.)
Step by Step Solution
There are 3 Steps involved in it

Get step-by-step solutions from verified subject matter experts