

Question: please solve each question step by step. 1. What is the critical value approach used for in hypothesis testing about population variances? A. To calculate
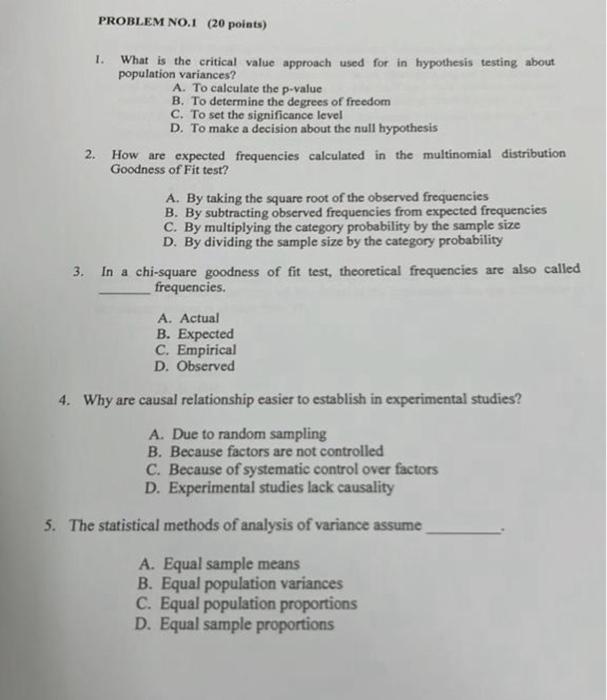
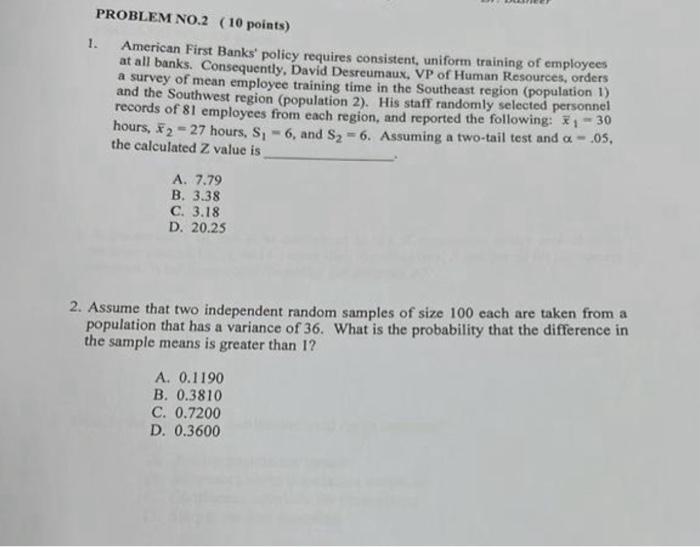
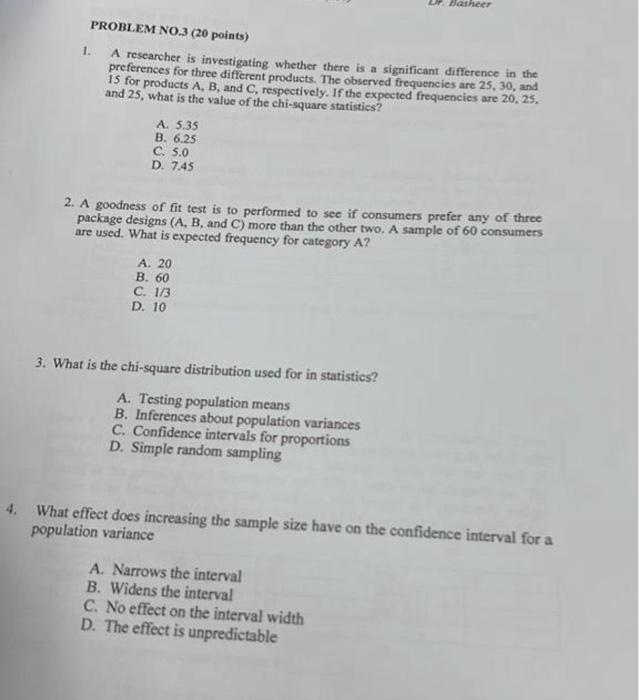
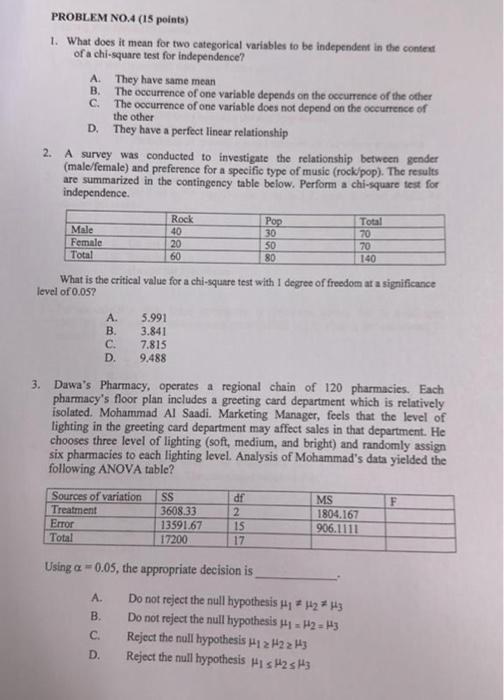
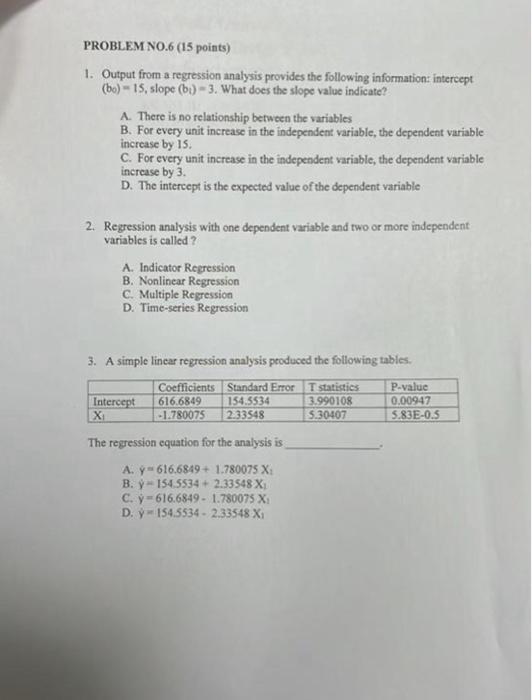
1. What is the critical value approach used for in hypothesis testing about population variances? A. To calculate the p-value B. To determine the degrees of freedom C. To set the significance level D. To make a decision about the null hypothesis 2. How are expected frequencies calculated in the multinomial distribution Goodness of Fit test? A. By taking the square root of the observed frequencies B. By subtracting observed frequencies from expected frequencies C. By multiplying the category probability by the sample size D. By dividing the sample size by the category probability 3. In a chi-square goodness of fit test, theoretical frequencies are also called frequencies. A. Actual B. Expected C. Empirical D. Observed 4. Why are causal relationship easier to establish in experimental studies? A. Due to random sampling B. Because factors are not controlled C. Because of systematic control over factors D. Experimental studies lack causality 5. The statistical methods of analysis of variance assume A. Equal sample means B. Equal population variances C. Equal population proportions D. Equal sample proportions 1. American First Banks' policy requires consistent, uniform training of employees at all banks. Consequently, David Desreumaux, VP of Human Resources, orders a survey of mean employee training time in the Southeast region (population 1) and the Southwest region (population 2). His staff randomly selected personnel records of 81 employees from each region, and reported the following: x1=30 hours, x2=27 hours, S1=6, and S2=6. Assuming a two-tail test and =.05, the calculated Z value is A. 7.79 B. 3.38 C. 3.18 D. 20.25 2. Assume that two independent random samples of size 100 each are taken from a population that has a variance of 36 . What is the probability that the difference in the sample means is greater than 1 ? A. 0.1190 B. 0.3810 C. 0.7200 D. 0.3600 1. A researcher is investigating whether there is a significant difference in the preferences for three different products. The observed frequencies are 25,30 , and is for products A, B, and C, respectively. If the expected frequencies are 20,25 , and 25 , what is the value of the chi-square statistics? A. 5.35 B. 6.25 C. 5.0 D. 7.45 2. A goodness of fit test is to performed to see if consumers prefer any of three package designs (A, B, and C) more than the other two. A sample of 60 consumers are used. What is expected frequency for category A ? A. 20 B. 60 C. 1/3 D. 10 3. What is the chi-square distribution used for in statistics? A. Testing population means B. Inferences about population variances C. Confidence intervals for proportions D. Simple random sampling What effect does increasing the sample size have on the confidence interval for a population variance A. Narrows the interval B. Widens the interval C. No effect on the interval width D. The effect is unpredictable 1. What does it mean for two categorical variables to be independent in the content of a chi-square test for independence? A. They have same mean B. The occurrence of one variable depends on the occurrence of the other C. The occurrence of one variable does not depend on the oceurrence of the other D. They have a perfect linear relationship 2. A survey was conducted to investigate the relationship between gender (male/female) and preference for a specific type of music (rock/pop). The results are summarized in the contingency table below. Perform a chi-square test for independence. What is the critical value for a chi-square test with 1 degree of freedom at a significance lovel of 0.05 ? A. 5.991 B. 3.841 C. 7.815 D. 9.488 3. Dawa's Pharmacy, operates a regional chain of 120 pharmacies. Each pharmacy's floor plan includes a greeting card department which is relatively isolated. Mohammad Al Saadi. Marketing Manager, feels that the level of lighting in the greeting card department may affect sales in that department. He chooses three level of lighting (soft, medium, and bright) and randomly assign six pharmacies to each lighting level. Analysis of Mohammad's data yielded the following ANOVA table? Using =0.05, the appropriate decision is A. Do not feject the null hypothesis 1=2=3 B. Do not reject the null hypothesis 1=2=3 C. Reject the null hypothesis 1223 D. Reject the null hypothesis 1s23 1. What is the experiment wise Type I error rate? A. Probability of making a type 1 error on at least one pairwise comparison B. Probability of rejecting the null hypothesis C. Probability of making type II error D. Probability of making a type I error on all pairwise comparisons 2. In experiment with four treatments, if the calculated F-statistics is 2.8 and the critical value for F at a 5% significance level is 3.2 , what decision should the researcher make? A. Reject B. Do not reject C. Redefine D. change the hypothesis 3. For an ANOVA with three treatments, if the mean square due to treatments (MSTR) is 40 and the mean square error (MSE) is 15, what is the calculated Fstatistic? A. 2.6 B. 2.5 C. 3.6 D. 3.5 4. Suppose the mean square for treatment in ANOVA are 24.4 and the mean squares for error are 9.8. There were four treatments and 7 subjects received each treatment (for a total of 28 ). The calculated value of F is ? A. 9.8 B. 34.2 C. 2.49 D. 14.6 1. Output from a regression analysis provides the following information: intercept (b0)=15, slope (b1)=3. What does the slope value indicate? A. There is no relationship between the variables B. For every unit increase in the independent variable, the dependent variable increase by is. C. For every unit increase in the independent variable, the dependent variable increase by 3. D. The intercept is the expected value of the dependent variable 2. Regression analysis with one dependent variable and two or more independent variables is called? A. Indicator Regression B. Nonlinear Regression C. Multiple Regression D. Time-series Regression 3. A simple linear regression analysis peoduced the following tables. The regression equation for the analysis is A. y=616.6849+1.780075X : B. y^=154.5534+2.33548X1 C. y=616.68491.780075X1 D. y^=154.55342.33548X1
Step by Step Solution
There are 3 Steps involved in it

Get step-by-step solutions from verified subject matter experts