

Question: please solve fast in text format ...handwritten solution not allowed ...dont use chat gpt The following two charts in Figure 1 and Figure 2 show
please solve fast in text format ...handwritten solution not allowed ...dont use chat gpt
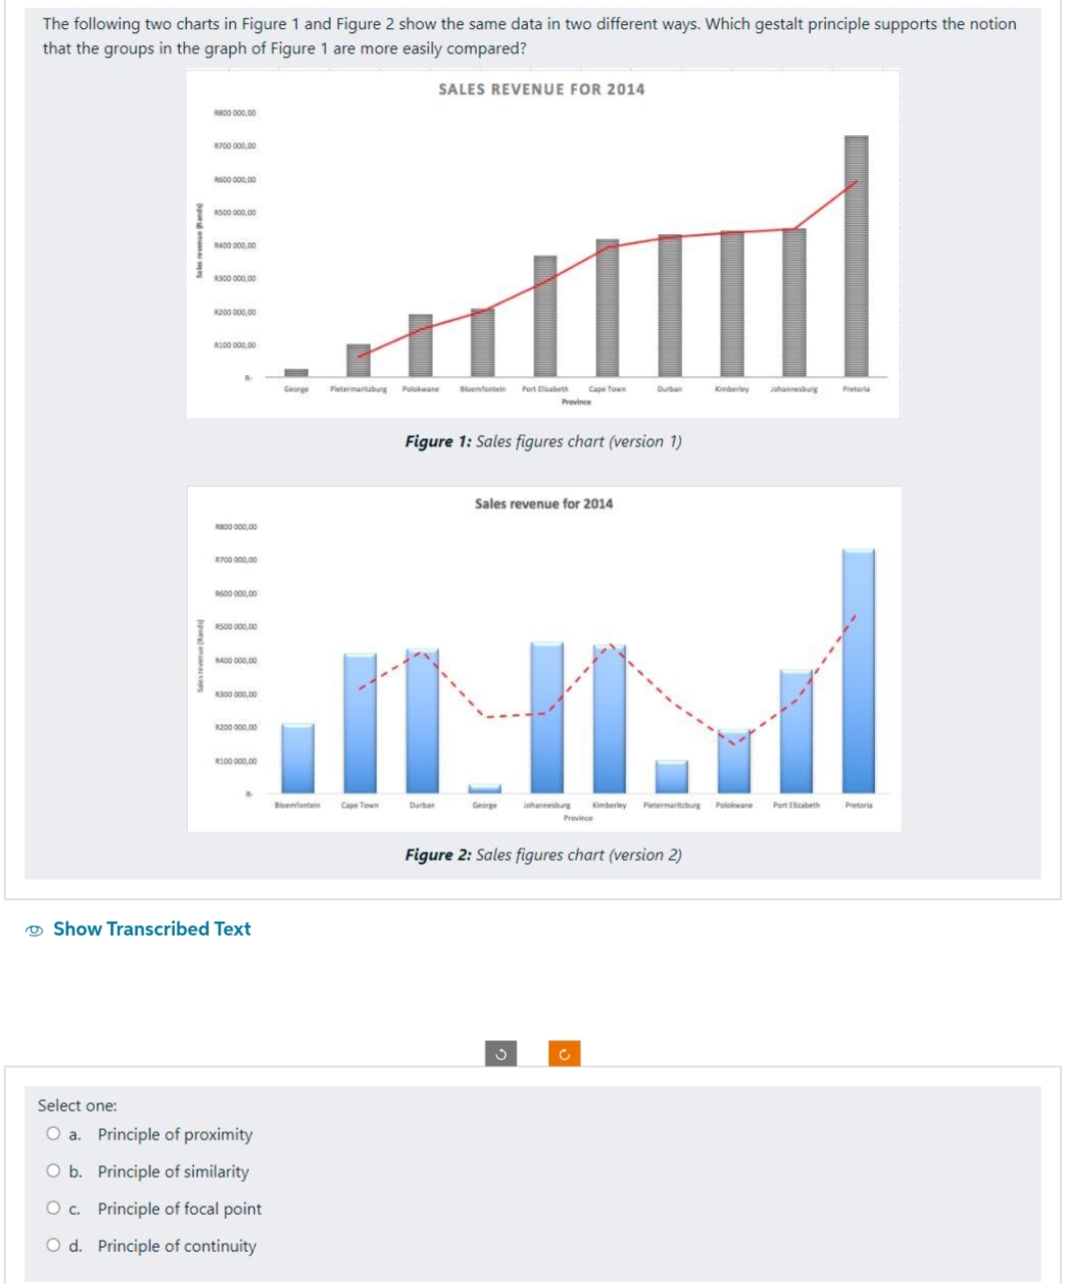
The following two charts in Figure 1 and Figure 2 show the same data in two different ways. Which gestalt principle supports the notion that the groups in the graph of Figure 1 are more easily compared? SALES REVENUE FOR 2014 #830 600,00 1500 900,00 300 000,00 4300 900,00 #200 900,60 George Petermarksburg Durban Kimberley Pretoria Figure 1: Sales figures chart (version 1) Sales revenue for 2014 4800 900,50 #750 900,00 2600 900,00 4500 000,00 #200 900.00 #360 600,00 Cape Town Durban Port Elizabeth Pretoria Province Figure 2: Sales figures chart (version 2) Show Transcribed Text C Select one: O a. Principle of proximity O b. Principle of similarity O c. Principle of focal point O d. Principle of continuity
Step by Step Solution
There are 3 Steps involved in it

Get step-by-step solutions from verified subject matter experts