

Question: please solve fast in text format ...handwritten solution not allowed ...dont use chat gpt Graph 8.1 Data plotted in the graph appear in the table
please solve fast in text format ...handwritten solution not allowed ...dont use chat gpt
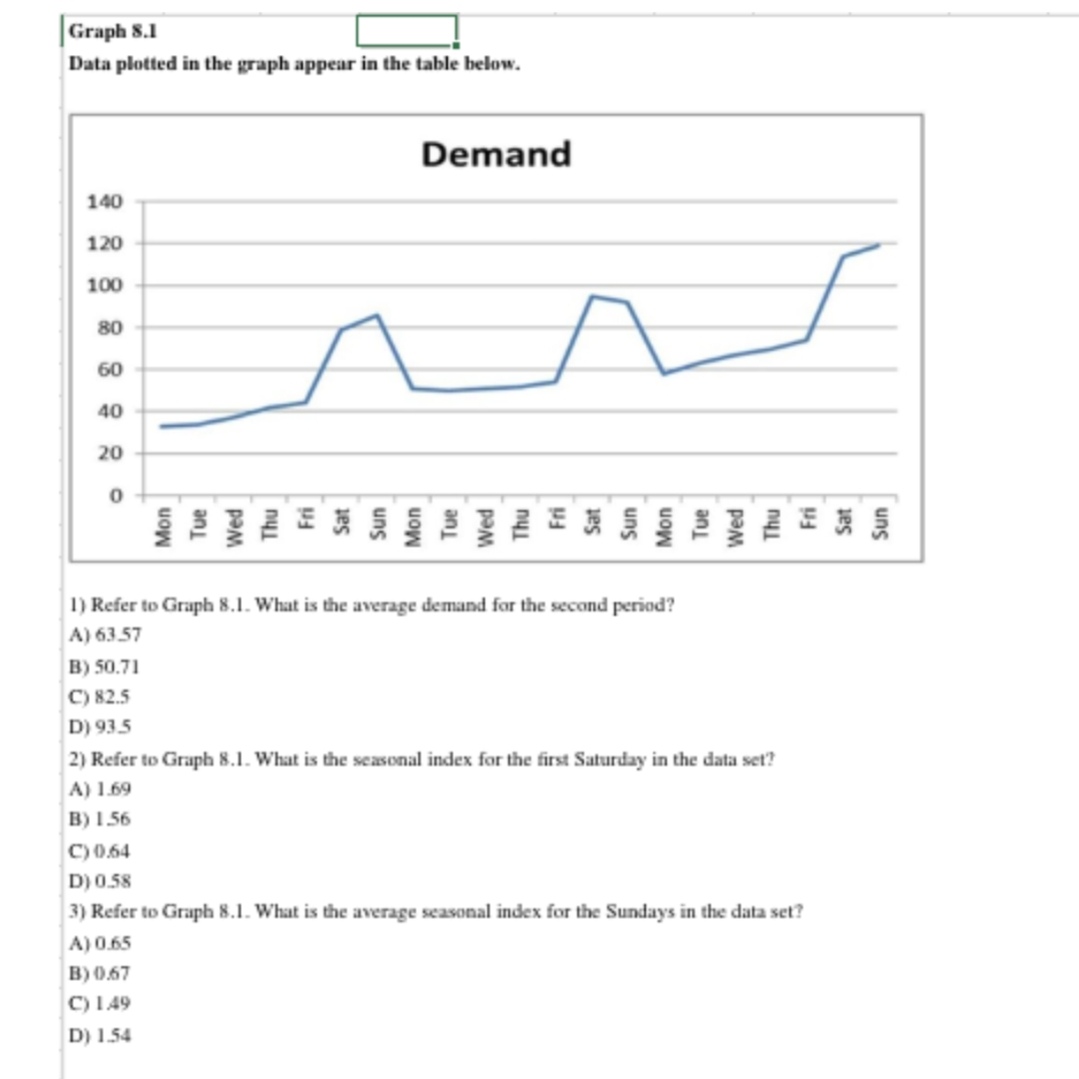
Graph 8.1 Data plotted in the graph appear in the table below. Demand 140 120 100 80 60 40 20 0 1) Refer to Graph 8.1. What is the average demand for the second period? A) 63.57 B) 50.71 C) 82.5 D) 93.5 2) Refer to Graph 8.1. What is the seasonal index for the first Saturday in the data set? A) 1.69 B) 1.56 C) 0.64 D) 0.58 3) Refer to Graph 8.1. What is the average seasonal index for the Sundays in the data set? A) 0.65 B) 0.67 C) 149 D) 1.54
Step by Step Solution
There are 3 Steps involved in it
1 Expert Approved Answer
Step: 1 Unlock

Question Has Been Solved by an Expert!
Get step-by-step solutions from verified subject matter experts
Step: 2 Unlock
Step: 3 Unlock