

Question: please solve fast in text format ...handwritten solution not allowed ...dont use chat gpt .provide detailed solutiom (1) Consider the stacked bar chart below that
please solve fast in text format ...handwritten solution not allowed ...dont use chat gpt
.provide detailed solutiom
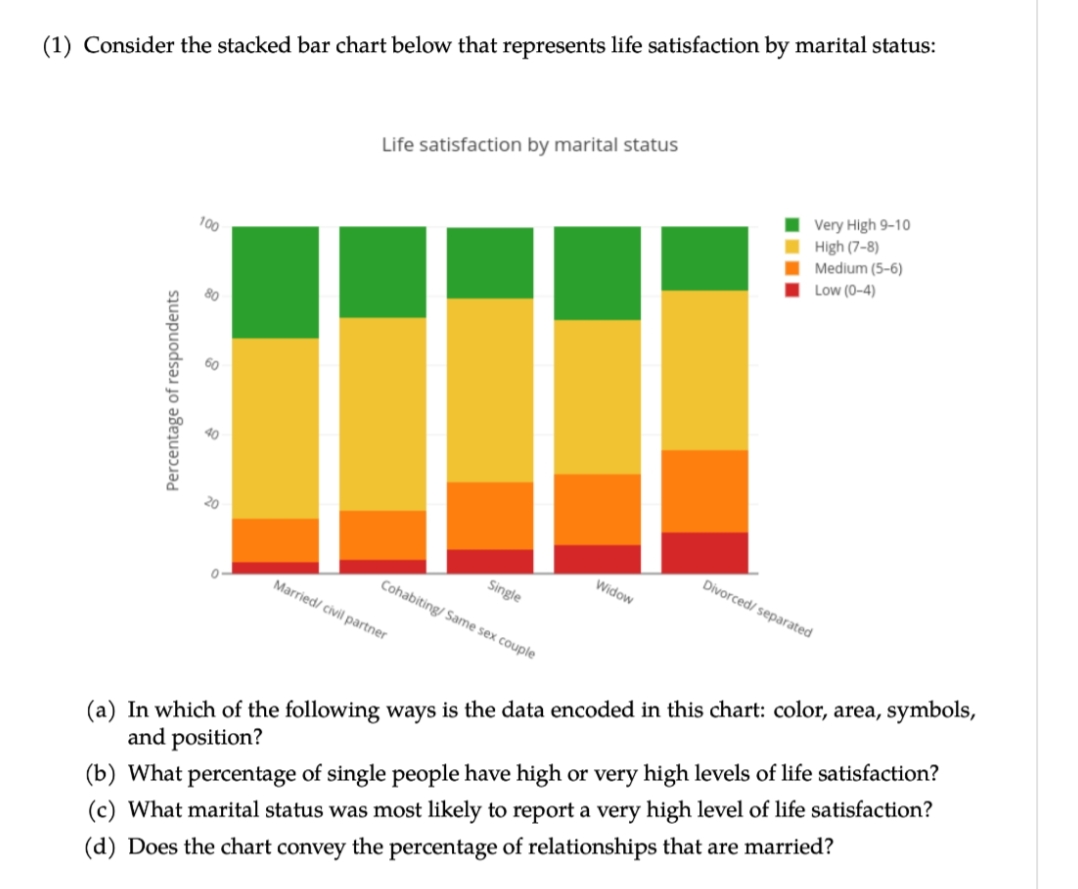
(1) Consider the stacked bar chart below that represents life satisfaction by marital status: Life satisfaction by marital status Very High 9-10 High (7-8) 100 Medium (5-6) Low (0-4) 80 60 Percentage of respondents 40 20 0- Single Widow Divorced/ separated Married/ civil partner Cohabiting/ Same sex couple (a) In which of the following ways is the data encoded in this chart: color, area, symbols, and position? (b) What percentage of single people have high or very high levels of life satisfaction? (c) What marital status was most likely to report a very high level of life satisfaction? (d) Does the chart convey the percentage of relationships that are married
Step by Step Solution
There are 3 Steps involved in it

Get step-by-step solutions from verified subject matter experts