

Question: please solve fast in text format ...handwritten solution not allowed ...dont use chat gpt Now look at the bar graphs for age and hours worked.
please solve fast in text format ...handwritten solution not allowed ...dont use chat gpt
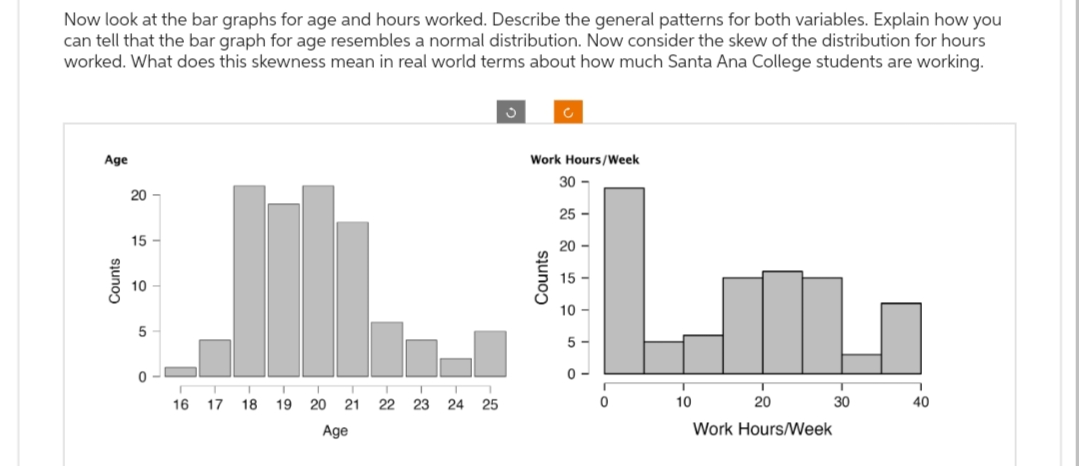
Now look at the bar graphs for age and hours worked. Describe the general patterns for both variables. Explain how you can tell that the bar graph for age resembles a normal distribution. Now consider the skew of the distribution for hours worked. What does this skewness mean in real world terms about how much Santa Ana College students are working. loll: "mufed; 30 - 25-. 20- E15- 10- 5. gZ;_I18II.I .- 17 2122232425 20139
Step by Step Solution
There are 3 Steps involved in it
1 Expert Approved Answer
Step: 1 Unlock

Question Has Been Solved by an Expert!
Get step-by-step solutions from verified subject matter experts
Step: 2 Unlock
Step: 3 Unlock