Please solve for Piotroski F-score (with all steps )
Also, please explain in excel with formula
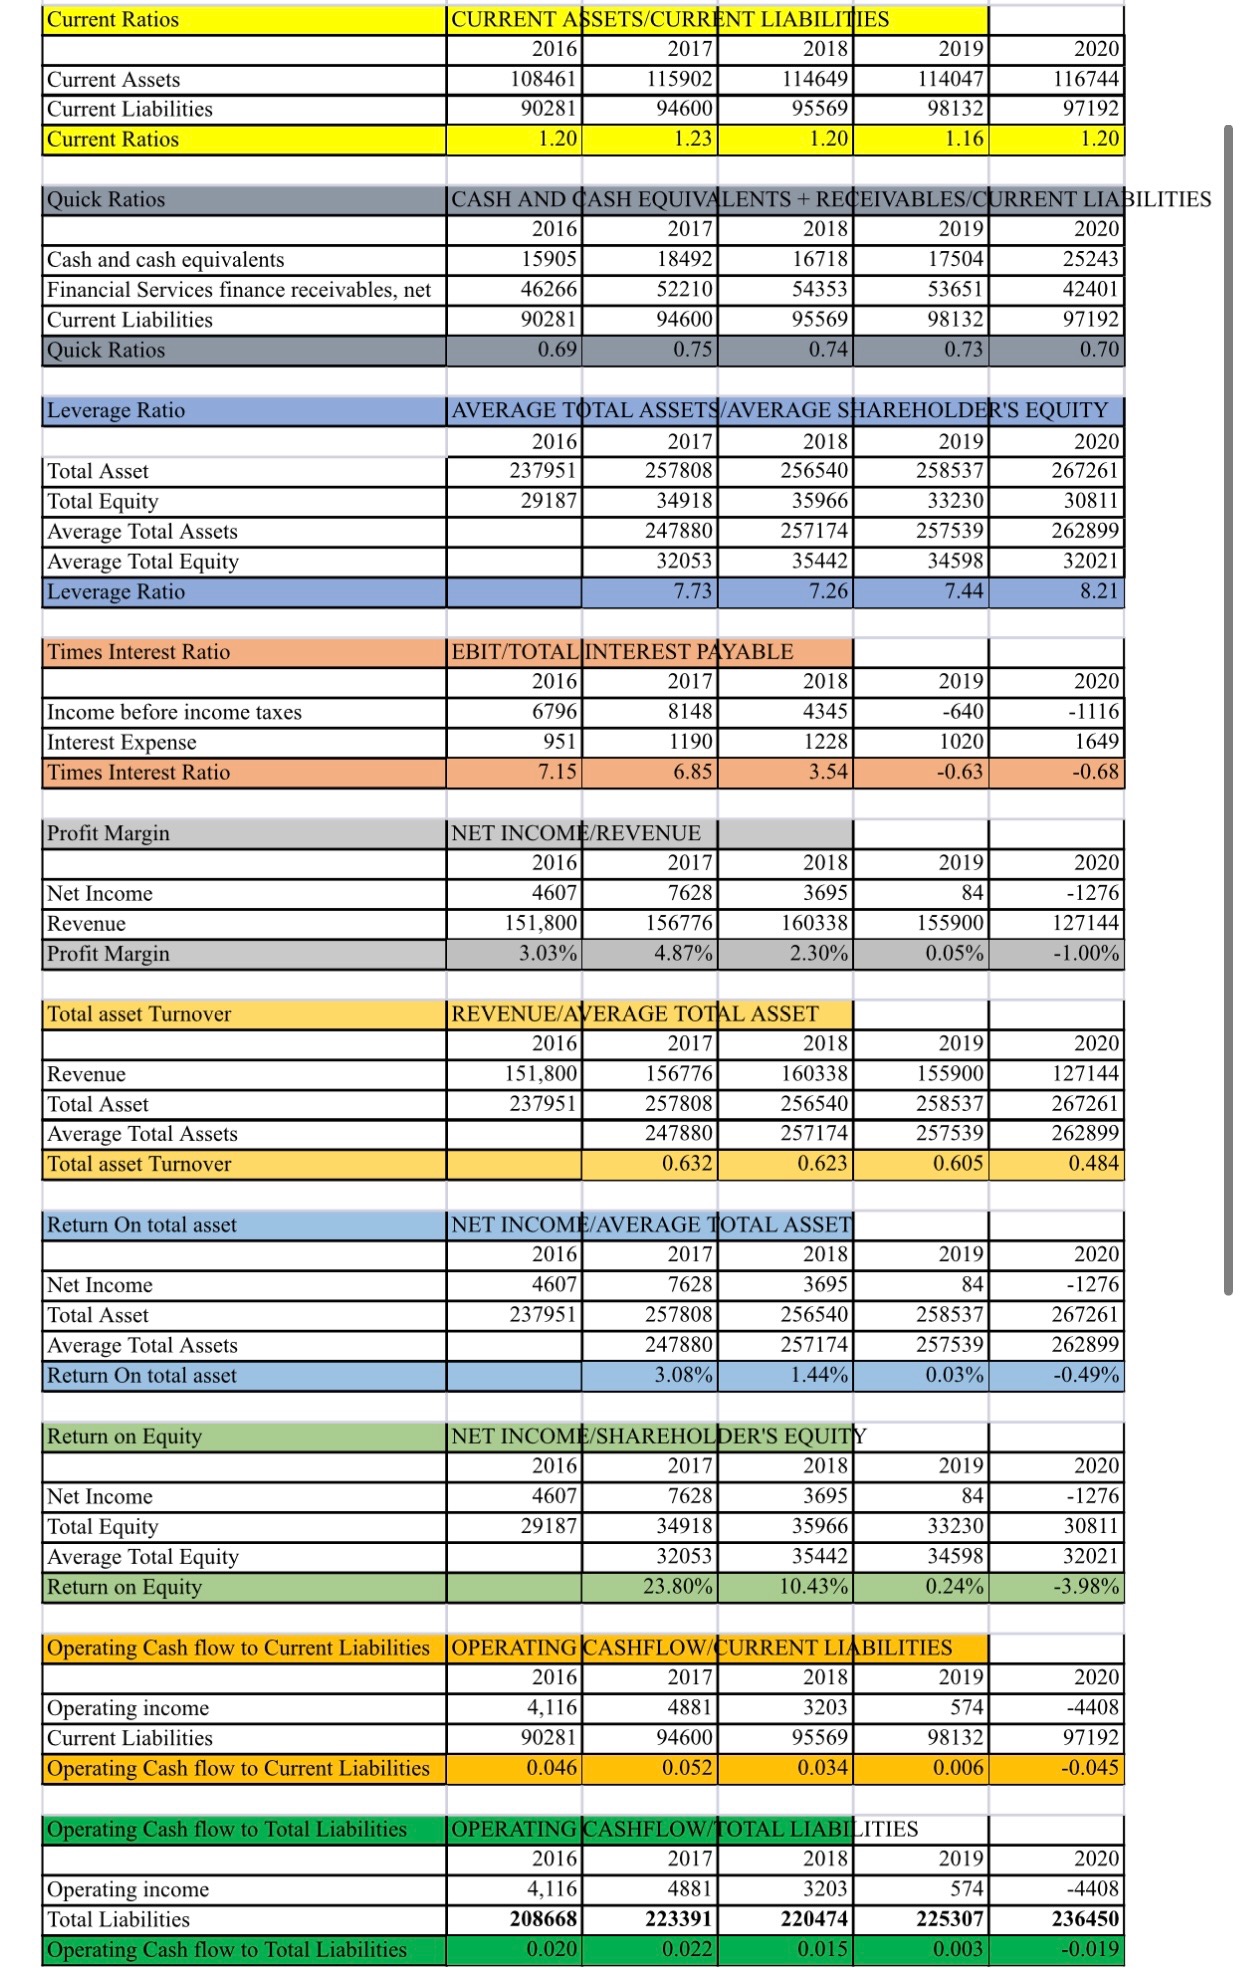
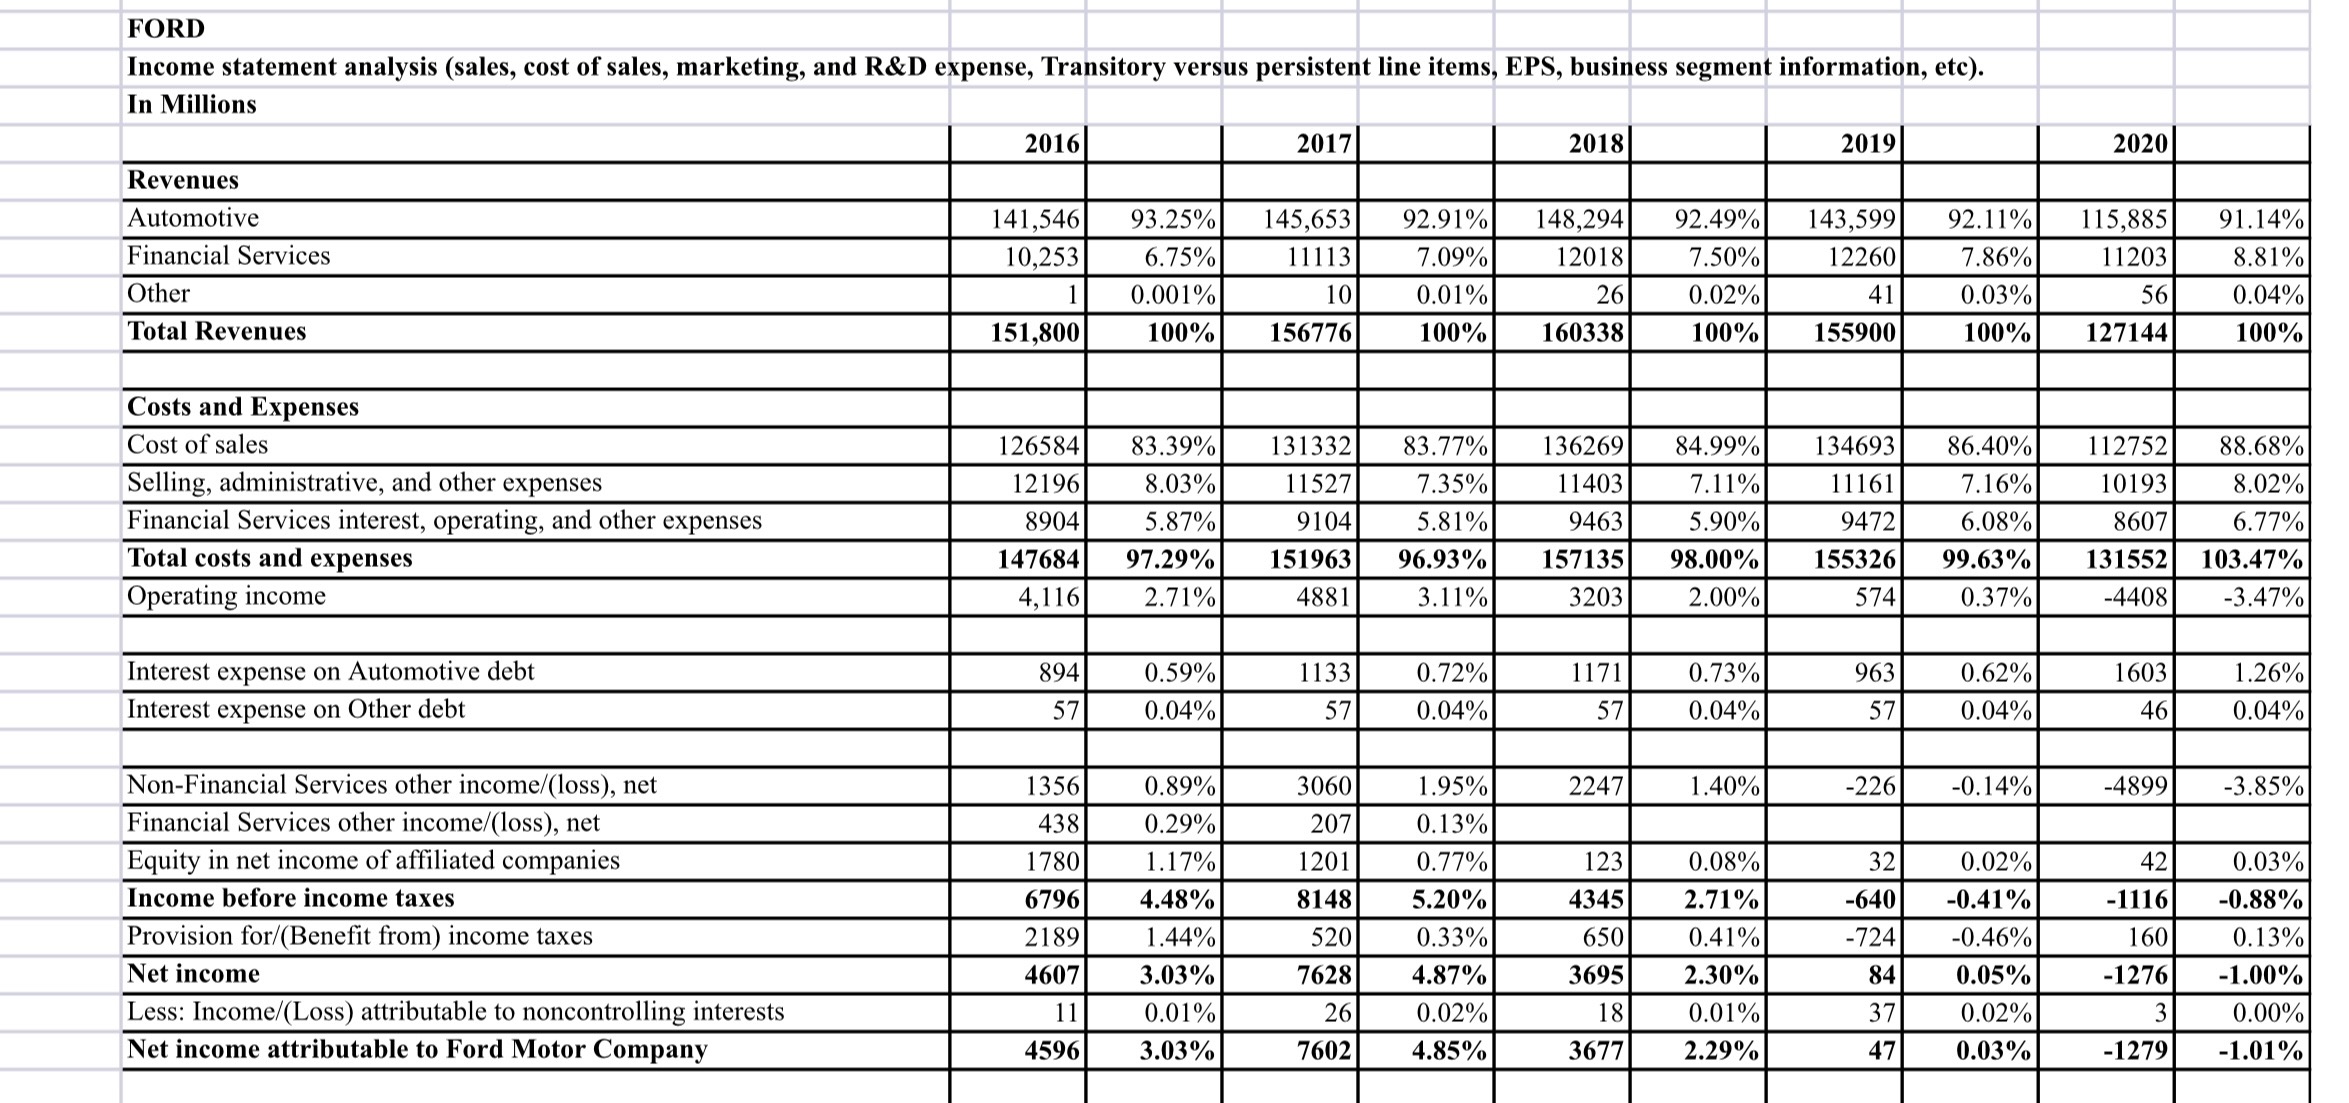
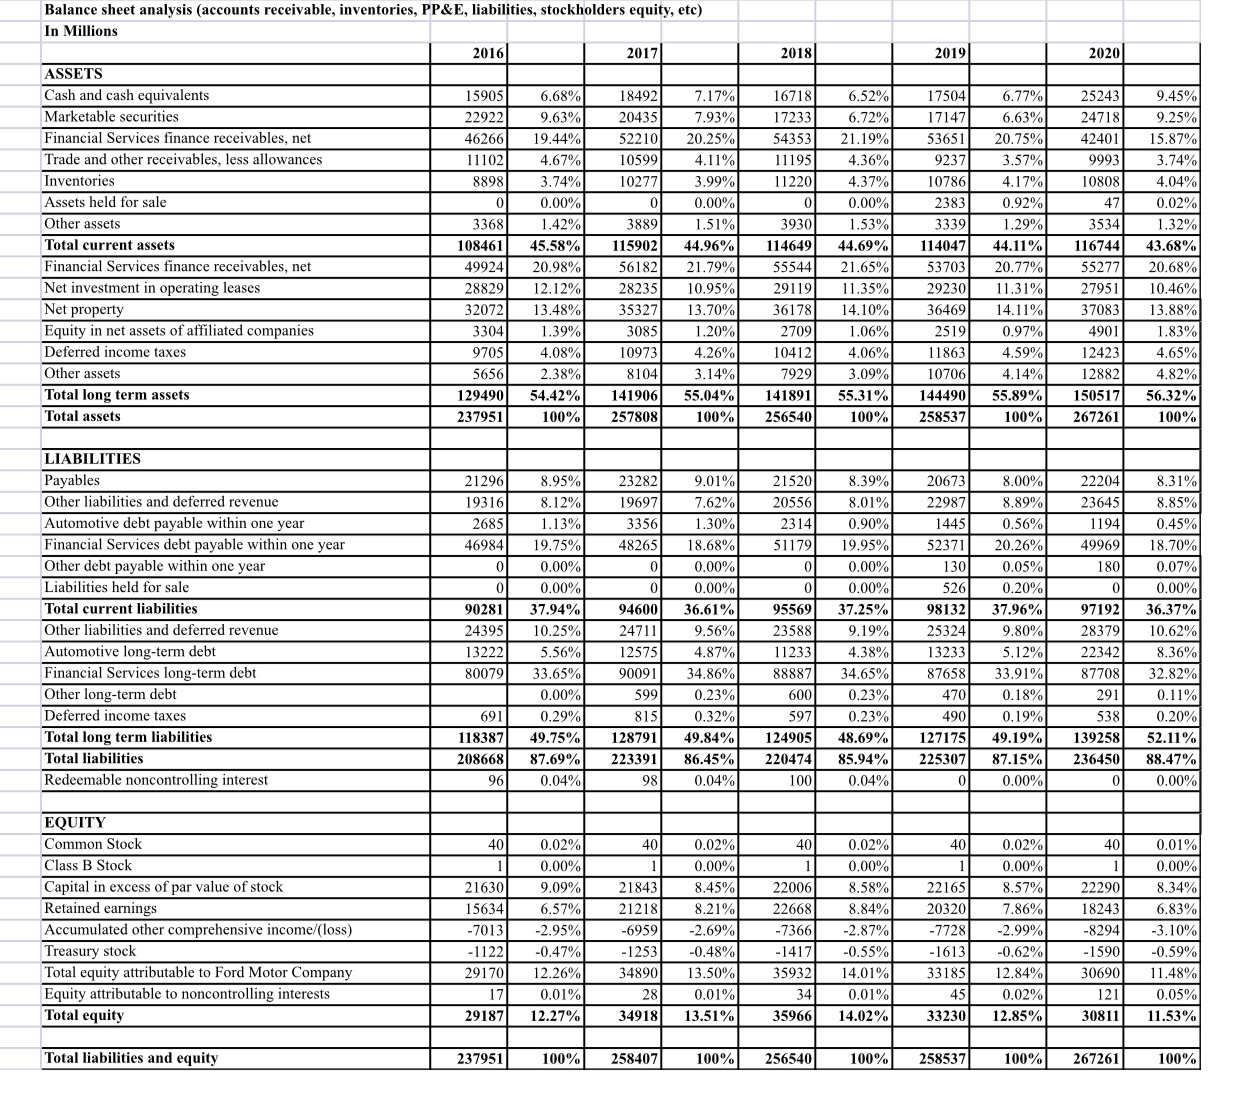
Current Ratios CURRENT ASSETS/CURRENT LIABILITIES 201 2017 2018 2019 2020 Current Assets 108461 15902 14649 14047 116744 Current Liabilities 90281 4600 95569 98132 7192 Current Ratio 1.20 1.23 1.20 1.16 1.20 Quick Ratios CASH AND CASH EQUIVALENTS + RECEIVABLES/CURRENT LIABILITIES 201 2017 2018 2019 2020 Cash and cash equivalents 5905 8492 16718 17504 25243 Financial Services finance receivables, net 46266 52210 4353 53651 42401 Current Liabilities 90281 4600 5569 98132 97192 Quick Ratios 0.69 0.75 0.74 0.73 0.70 Leverage Ratio AVERAGE TOTAL ASSETS/AVERAGE SHAREHOLDER'S EQUITY 2016 2017 2018 2019 2020 Total Asset 237951 257808 256540 258537 267261 Total Equity 29187 34918 35966 33230 30811 Average Total Assets 247880 257174 257539 262899 Average Total Equity 2053 35442 34598 32021 Leverage Ratio 7.73 7.26 7.44 3.21 Times Interest Ratio EBIT/TOTAL INTEREST PAYABLE 2016 2017 2018 2019 2020 Income before income taxes 6796 3148 434 .640 -1116 Interest Expense 951 190 228 1020 649 Times Interest Ratio 7.15 6.85 3.54 -0.63 0.68 Profit Margin NET INCOME/REVENUE 2016 2017 2018 2019 2020 Net Income 460 7628 $695 34 -1276 Revenue 151,80 156776 160338 55900 127144 Profit Margin 3.03% 4.87% 2.30% 0.05% 1.00% Total asset Turnover REVENUE/AVERAGE TOTAL ASSET 2016 2017 201 2019 2020 Revenue 151,800 156776 60338 55900 127144 Total Asset 237951 257808 256540 258537 267261 Average Total Assets 247880 257174 257539 262899 Total asset Turnover 0.632 ).623 0.605 .484 Return On total asset NET INCOME/AVERAGE TOTAL ASSET 2016 2017 2018 2019 2020 Net Income 4607 7628 3695 84 1276 Total Asset 237951 257808 256540 258537 267261 Average Total Assets 247880 257174 257539 262899 Return On total asset 3.08% 1.44% 0.03% -0.49% Return on Equity NET INCOME/SHAREHOLDER'S EQUITY 2016 2017 2018 2019 2020 Net Income 4607 7628 3695 84 -1276 Total Equity 29187 34918 35966 33230 30811 Average Total Equity 2053 5442 34598 32021 Return on Equity 3.80% 10.43% ).24% 3.98% Operating Cash flow to Current Liabilities OPERATING CASHFLOW/CURRENT LIABILITIES 2016 2017 2018 2019 2020 Operating income 4, 116 4881 3203 574 4408 Current Liabilities 90281 4600 95569 98132 97192 Operating Cash flow to Current Liabilities 0.046 ).052 0.034 .006 -0.045 Operating Cash flow to Total Liabilities OPERATING CASHFLOW/TOTAL LIABILITIES 2016 201 2018 2019 2020 Operating income 4,116 1881 3203 574 4408 Total Liabilities 208668 223391 220474 225307 236450 Operating Cash flow to Total Liabilities 0.020 0.022 0.015 0.003 -0.019FORD Income statement analysis (sales, cost of sales, marketing, and R&D expense, Transitory versus persistent line items, EPS, business segment information, etc). In Millions 2017 2018 2019 2020 Revenues Automotive 92.91% 148,294 92.49% 143,599 92.11% 115,885 91.14% Financial Services 7.09% 12018 7.50% 12260 7.86% 11203 8.81% Other 10 0.01% 26 0.02% 41 0.03% 56 0.04% Total Revenues 100% 160338 100% 155900 100% 127144 100% Costs and Expenses Cost of sales 83.77% 136269 84.99% 34693 86.40% 112752 88.68% Selling, administrative, and other expenses 7.35% 11403 7.11% 11161 7.16% 10193 8.02% Financial Services interest, operating, and other expenses 8904 5.87% 9104 5.81% 9463 5.90% 9472 6.08% 3607 5.77% Total costs and expenses 147684 97.29% 151963 96.93% 157135 98.00% 155326 99.63% 131552 103.47% Operating income 4,116 2.71% 4881 3.11% 3203 2.00% 574 0.37% 4408 -3.47% interest expense on Automotive debt 894 0.59% 1133 0.72% 1171 0.73% 963 0.62% 1603 1.26% Interest expense on Other debt 57 0.04% 57 0.04% 57 0.04% 57 0.04% 46 0.04% Non-Financial Services other income/(loss), net 1356 0.89% 3060 1.95% 2247 1.40% -226 -0.14% -4899 -3.85% Financial Services other income/(loss), net 438 0.29% 207 0.13% Equity in net income of affiliated companies 1780 1.17% 1201 0.77% 123 0.08% 32 0.02% 42 0.03% Income before income taxes 6796 4.48% 8148 5.20% 4345 2.71% -640 -0.41% -1116 -0.88% Provision for/(Benefit from) income taxes 2189 1.44% 520 0.33% 650 0.41% .724 -0.46% 60 .13% Net income 4607 3.03% 7628 4.87% 3695 2.30% 34 0.05% -1276 -1.00% Less: Income/(Loss) attributable to noncontrolling interests 11 0.01% 26 0.02% 18 0.01% 37 .02% 3 0.00% Net income attributable to Ford Motor Company 4596 3.03% 7602 4.85% 3677 2.29% 47 0.03% -1279 -1.01%Balance sheet analysis (accounts receivable, inventories, PP&E, liabilities, stockholders equity, etc) In Millions 2016 ASSETS 2017 2018 2019 2020 Cash and cash equivalents 159051 Marketable securities 6.68% 18492 7.17% 16718 6.52% 22922 17504 9.63% 6.77% 20435 25243 9.45% Financial Services finance receivables, net 7.93% 1723. 6.72% 46266 17147 19.44% 6.63% 522101 24718 20.25% 9.25% Trade and other receivables, less allowances 5435 21.19% 11102 53651 4.67% 20.75% 42401 Inventories 10599 4.11% 1119 15.87% 4.36% 8898 9237 3.57% 9993 3.74% Assets held for sale 3.74% 0277 3.99% 1 1220 4.37% 10786 4.17% 0.00% 0.00% 10808 4.04% Other assets 0.00% 2383 3368 0.92% 47 0.02% Total current assets 1.42% 38891 1.51% 3930 1.53% 108461 33391 1.29% 3534 Financial Services finance receivables, net 45.58% 115902 44.96% 1.32% 114649 49924 44.69% 114047 20.98% 44.11% 56182 116744 43.68% Net investment in operating lease 21.79% 5554 28829 21.65% 53703 Net property 2.12% 20.77% 18235 55277 0.95% 2911 20.68% 11.35% 2072 29230 3.48% 5327 1.31% 27951 Equity in net assets of affiliated companies 3.70% 3617 0.46% 4.10% 3304 6469 4.11% 1.39% 37083 3.88% Deferred income taxes 3085 1.20% 2709 1.06% 9705 2519 4.08% 10973 0.97% 4.26% 4901 1.83% Other assets 10412 4.06% 5656 11863 2.38% 4.59% 3104 12423 3.14% 4.65% Total long term assets 7929 3.09% 129490 10706 4.14% 12882 4.82% Total assets 54.42% 141906 55.04% 141891 55.31% 237951 144490 100% 55.89% 257808 150517 00% 56.32% 256540 00% 258537 100% 267261 100% LIABILITIES Payables 21296 8.95% Other liabilities and deferred revenue 23282 9.01% 21520 8.39% 20673 19316 8.00% 8. 12% 22204 19697 8.31% Automotive debt payable within one year 7.62% 20556 8.01% 2685 22987 1.13% 8.89% 23645 Financial Services debt payable within one year 356 1.30% 2314 8.85% 0.90% 46984 1445 19.75% 0.56% 1194 Other debt payable within one year 18265 18.68% 0.45% 1179 19.95% 52371 0.00% 20.26% 49969 0.00% 18.70% Liabilities held for sale 1.00% 0.00% 130 ).05% 180 0.07% Total current liabilities 0.00% ).00% 0281 526 37.94% 0.20% Other liabilities and deferred revenue 94600 36.61% 0.00% 9556 37.25% 24395 98137 10.25% 37.96% Automotive long-term debt 24711 97192 9.56% 36.37% 23588 9.19% 13222 25324 5.56% 9.80% 28379 4.87% 11233 10.62% Financial Services long-term debt 12575 4.38% 80079 13233 5.12% 22342 8.36% Other long-term d 33.65% 90091 34.86% 88887 34.65% 0.00% 87658 599 33.91% 87708 ).23% 600 32.82% Deferred income taxes 691 0.23% 0.29% 815 470 0.18% 291 0.32% 0.11% Total long term liabilities 0.23% 118387 Total liabilitie 49.75% 490 0.19% 128791 538 49.84% 124905 0.20% 208668 48.69% 87.69% 223391 127175 49.19% Redeemable noncontrolling interest 86.45% 139258 220474 52.11% 85.94% 225307 96 87.15% 0.04% 236450 98 88.47% 0.04% 100 0.04% 0.00% 0.00% EQUITY Common Stock Class B Stock 40 0.02% 40 0.02% 40 0.02% 0.00% 10 0.02% 0.00% 401 0.01% Capital in excess of par value of stock 0.00% 21630 9.09% ).00% 1843 8.45% 0.00% Retained earnings 22006 3.58% 22165 15634 6.57% 8.57% 22290 21218 8.21% 8.34% Accumulated other comprehensive income/(loss) 2668 8.84% -7013 203201 -2.95% 7.86% -6959 18243 -2.69% 6.83% Treasury stock 7366 -2.87% -7728 -1122 -0.47% 2.99% -1253 -8294 -0.48% -3.10% Total equity attributable to Ford Motor Company 1417 -0.55% 29170 -1613 2.26% -0.62% Equity attributable to noncontrolling interests 4890 -1590 3.50% -0.59% 35932 17 4.01% $3185 28 2.84% 34 30690 11.48% Total equity 0.01% 0.01% 0.01% 45 19187 12.27% 0.02% 121 34918 13.51% 0.05% 35966 14.02% 33230 12.85% 30811 11.53% Total liabilities and equity 237951 100% 258407 100% 256540 100% 258537 100% 267261 100%