

Question: Please solve it in Excel step by step. Part! Question 1. The personnel section of a large logistics company suspects that the sickness absence rates
Please solve it in Excel step by step. 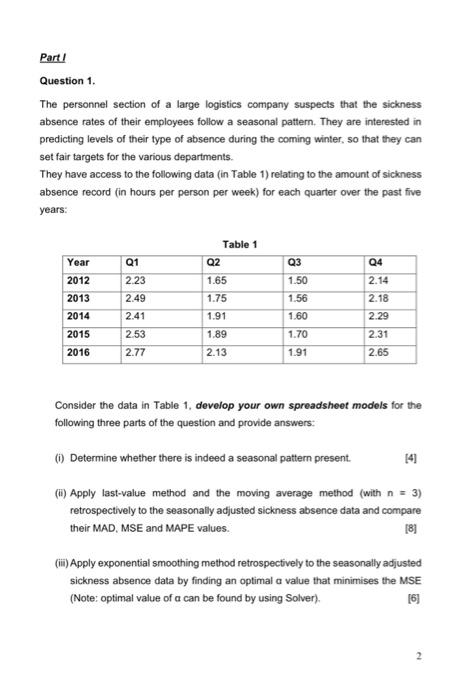
Part! Question 1. The personnel section of a large logistics company suspects that the sickness absence rates of their employees follow a seasonal pattern. They are interested in predicting levels of their type of absence during the coming winter, so that they can set fair targets for the various departments. They have access to the following data (in Table 1) relating to the amount of sickness absence record (in hours per person per week) for each quarter over the past five years: Table 1 Year Q1 Q2 Q3 Q4 2012 2.23 1.65 1.50 2.14 2013 2.49 1.75 1.56 2.18 2014 2.41 1.91 1.60 2.29 2015 2.53 1.89 1.70 2.31 2016 2.77 2.13 1.91 2.65 Consider the data in Table 1, develop your own spreadsheet models for the following three parts of the question and provide answers: (i) Determine whether there is indeed a seasonal pattern present. (ii) Apply last-value method and the moving average method (with n = 3) retrospectively to the seasonally adjusted sickness absence data and compare their MAD, MSE and MAPE values. (iii) Apply exponential smoothing method retrospectively to the seasonally adjusted sickness absence data by finding an optimal a value that minimises the MSE (Note: optimal value of a can be found by using Solver). [6] Step by Step Solution
There are 3 Steps involved in it
1 Expert Approved Answer
Step: 1 Unlock

Question Has Been Solved by an Expert!
Get step-by-step solutions from verified subject matter experts
Step: 2 Unlock
Step: 3 Unlock