

Question: please solve my question. Question 2 A student representative studied the amount of money (in RM), School of Computing (SC) students spend on online game
please solve my question.
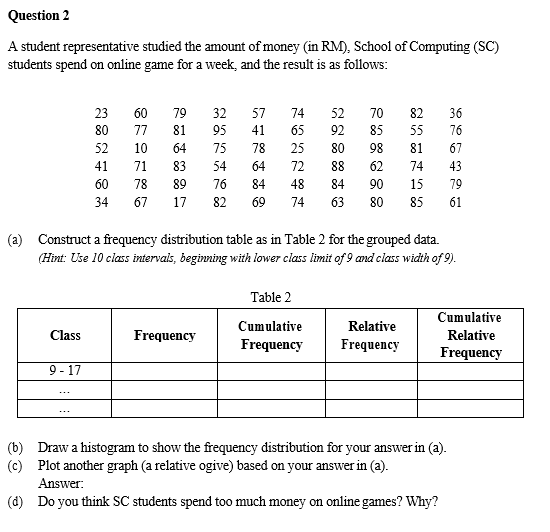
Question 2 A student representative studied the amount of money (in RM), School of Computing (SC) students spend on online game for a week, and the result is as follows: 23 60 79 32 57 74 52 70 82 36 80 77 81 95 41 65 92 85 55 76 52 10 64 75 78 25 80 98 81 67 41 71 83 54 64 72 88 62 74 43 60 78 89 76 84 48 84 90 15 79 34 67 17 82 69 74 63 80 85 61 (a) Construct a frequency distribution table as in Table 2 for the grouped data. (Hint: Use 10 class intervals, beginning with lower class limit of 9 and class width of 9). Table 2 Cumulative Cumulative Relative Class Frequency Relative Frequency Frequency Frequency 9 - 17 . . . ... (b) Draw a histogram to show the frequency distribution for your answer in (a). (C) Plot another graph (a relative ogive) based on your answer in (a). Answer: (d) Do you think SC students spend too much money on online games? Why
Step by Step Solution
There are 3 Steps involved in it

Get step-by-step solutions from verified subject matter experts