

Question: Please Solve number 8 and show the layout visually. Thank you information center, (g) physical recreation center or gymnasium, and (h) infirmary. Develop a develop
Please Solve number 8 and show the layout visually. Thank you
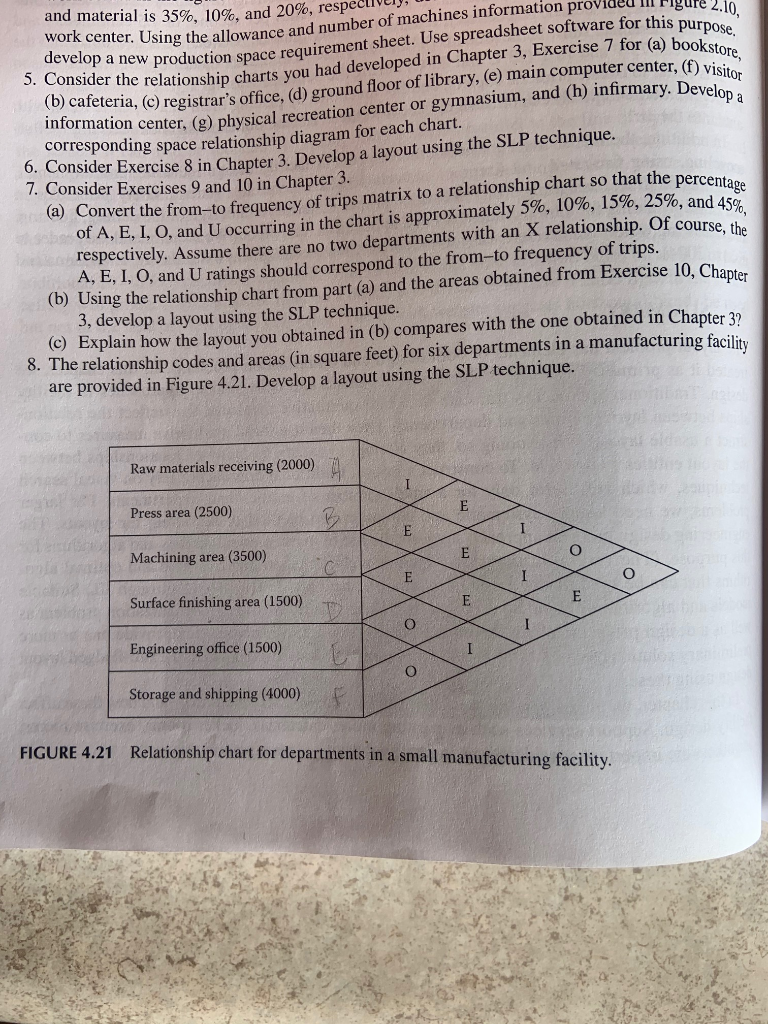
information center, (g) physical recreation center or gymnasium, and (h) infirmary. Develop a develop a new production space requirement sheet. Use spreadsheet software for this purpose. 5. Consider the relationship charts you had developed in Chapter 3, Exercise 7 for (a) bookstore, (b) cafeteria, (c) registrar's office, (d) ground floor of library, (e) main computer center, (f) visitor and material is 35%, 10%, and 20%, respect Figure 2.10, work center. Using the allowance and number of machines information provided corresponding space relationship diagram for each chart. 6. Consider Exercise 8 in Chapter 3. Develop a layout using the SLP technique. 7. Consider Exercises 9 and 10 in Chapter 3. a) Convert the from-to frequency of trips matrix to a relationship chart so that the percentage of A, E, I, O, and U occurring in the chart is approximately 5%, 10%, 15%, 25%, and 45% respectively. Assume there are no two departments with an X relationship. Of course, the A, E, I, O, and U ratings should correspond to the from-to frequency of trips. (b) Using the relationship chart from part (a) and the areas obtained from Exercise 10, Chapter 3, develop a layout using the SLP technique. (C) Explain how the layout you obtained in (b) compares with the one obtained in Chapter 3? 8. The relationship codes and areas (in square feet) for six departments in a manufacturing facility are provided in Figure 4.21. Develop a layout using the SLP technique. Raw materials receiving (2000) 1 E Press area (2500) B E 1 o Machining area (3500) E E I O Surface finishing area (1500) E E O I Engineering office (1500) I O Storage and shipping (4000) FIGURE 4.21 Relationship chart for departments in a small manufacturing facility. information center, (g) physical recreation center or gymnasium, and (h) infirmary. Develop a develop a new production space requirement sheet. Use spreadsheet software for this purpose. 5. Consider the relationship charts you had developed in Chapter 3, Exercise 7 for (a) bookstore, (b) cafeteria, (c) registrar's office, (d) ground floor of library, (e) main computer center, (f) visitor and material is 35%, 10%, and 20%, respect Figure 2.10, work center. Using the allowance and number of machines information provided corresponding space relationship diagram for each chart. 6. Consider Exercise 8 in Chapter 3. Develop a layout using the SLP technique. 7. Consider Exercises 9 and 10 in Chapter 3. a) Convert the from-to frequency of trips matrix to a relationship chart so that the percentage of A, E, I, O, and U occurring in the chart is approximately 5%, 10%, 15%, 25%, and 45% respectively. Assume there are no two departments with an X relationship. Of course, the A, E, I, O, and U ratings should correspond to the from-to frequency of trips. (b) Using the relationship chart from part (a) and the areas obtained from Exercise 10, Chapter 3, develop a layout using the SLP technique. (C) Explain how the layout you obtained in (b) compares with the one obtained in Chapter 3? 8. The relationship codes and areas (in square feet) for six departments in a manufacturing facility are provided in Figure 4.21. Develop a layout using the SLP technique. Raw materials receiving (2000) 1 E Press area (2500) B E 1 o Machining area (3500) E E I O Surface finishing area (1500) E E O I Engineering office (1500) I O Storage and shipping (4000) FIGURE 4.21 Relationship chart for departments in a small manufacturing facilityStep by Step Solution
There are 3 Steps involved in it
1 Expert Approved Answer
Step: 1 Unlock

Question Has Been Solved by an Expert!
Get step-by-step solutions from verified subject matter experts
Step: 2 Unlock
Step: 3 Unlock