

Question: Please solve on matlab I can't add a file so I added a photo clear all % clears all active variables close all clc load('ecg_Noisy');
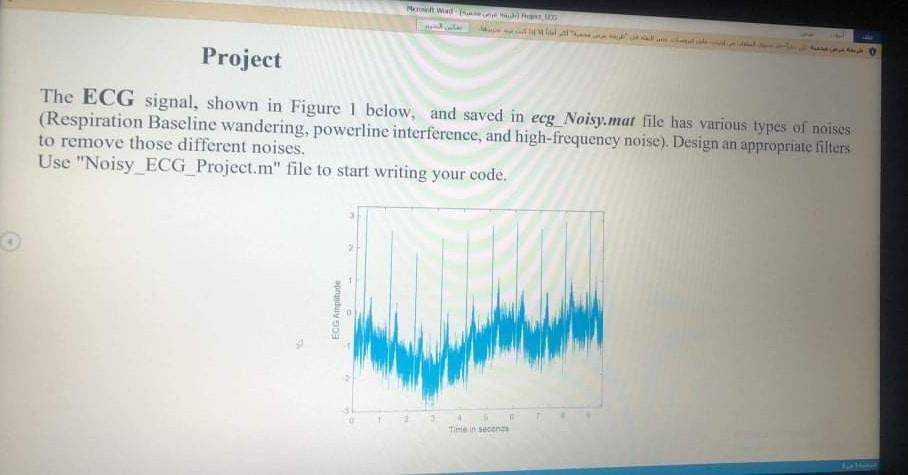
Please solve on matlab
I can't add a file so I added a photo
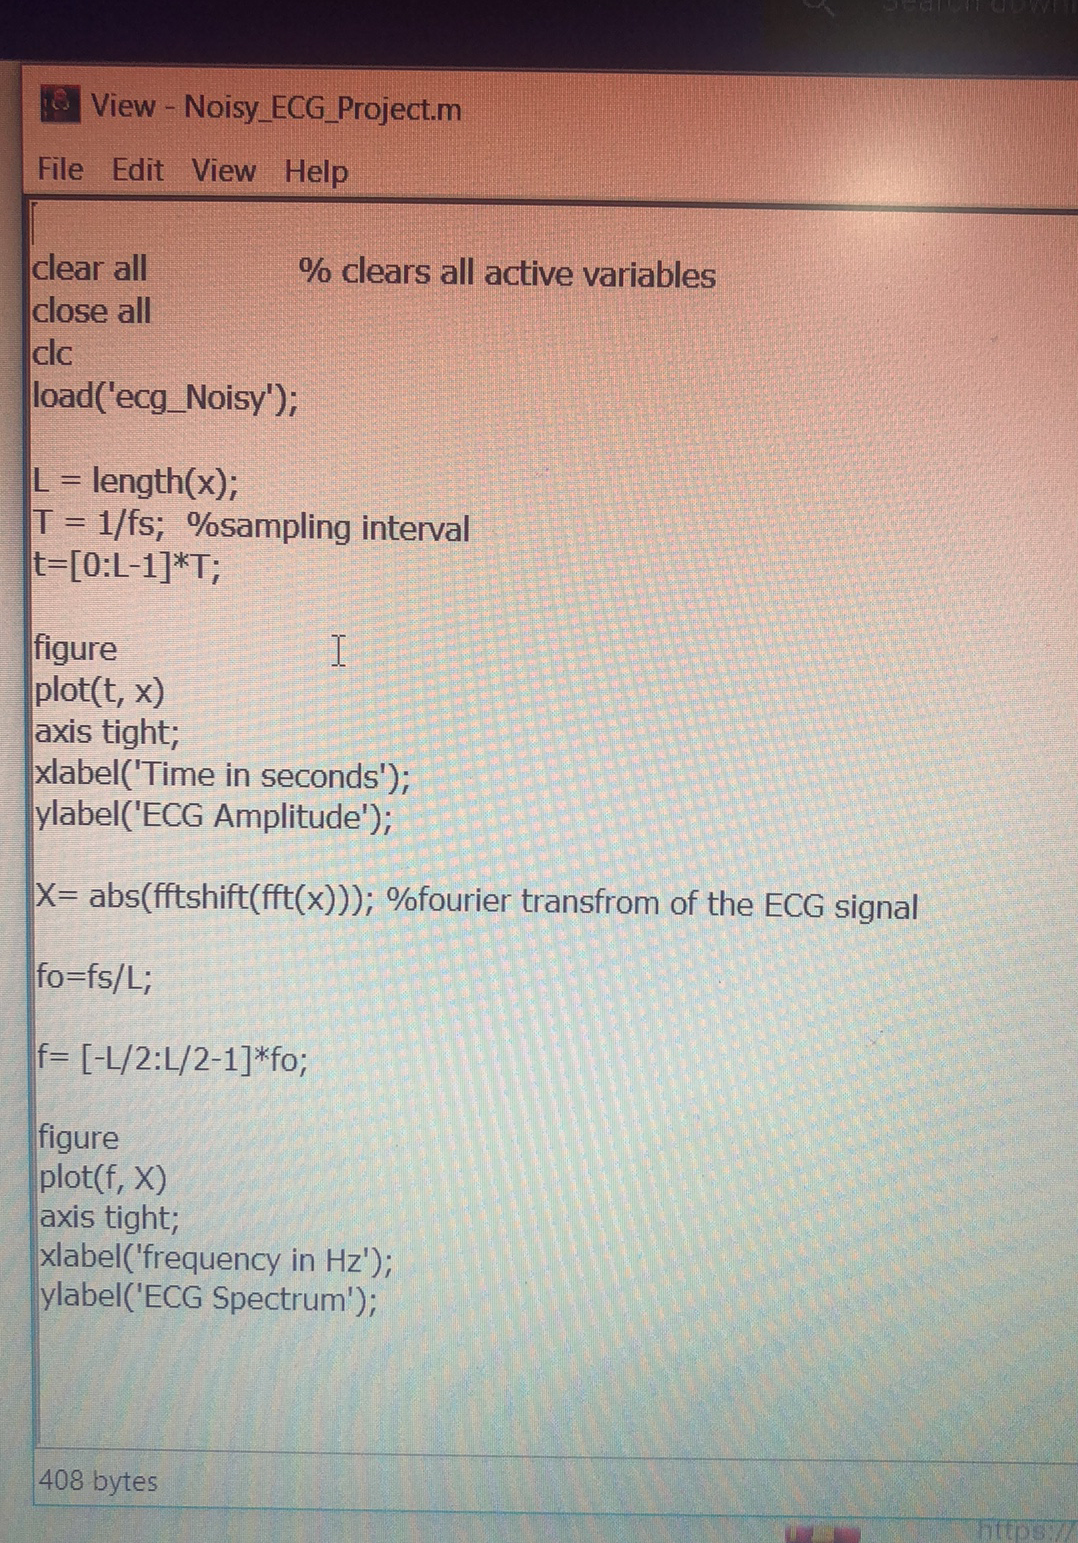
clear all % clears all active variables close all clc load('ecg_Noisy');
L = length(x); T = 1/fs; %sampling interval t=[0:L-1]*T;
figure plot(t, x) axis tight; xlabel('Time in seconds'); ylabel('ECG Amplitude');
X= abs(fftshift(fft(x))); %fourier transfrom of the ECG signal
fo=fs/L;
f= [-L/2:L/2-1]*fo;
figure plot(f, X) axis tight; xlabel('frequency in Hz'); ylabel('ECG Spectrum');
![clc load('ecg_Noisy'); L = length(x); T = 1/fs; %sampling interval t=[0:L-1]*T; figure](https://dsd5zvtm8ll6.cloudfront.net/si.experts.images/questions/2024/09/66f332748c4f3_19666f3327414a8a.jpg)
![transfrom of the ECG signal fo=fs/L; f= [-L/2:L/2-1]*fo; figure plot(f, X) axis](https://dsd5zvtm8ll6.cloudfront.net/si.experts.images/questions/2024/09/66f3327621931_19766f332758879e.jpg)
Is this enough? How can I insert a file
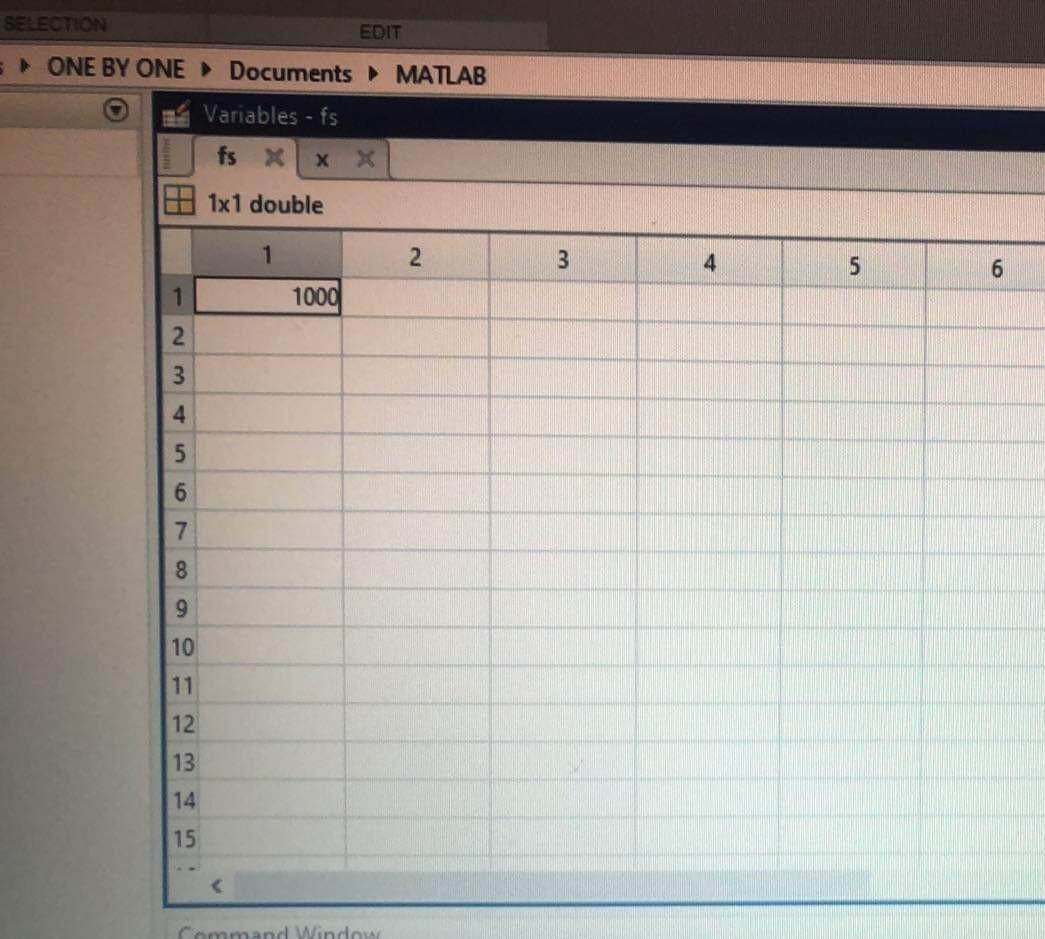
ION EDIT E BY ONE Documents MATLAB Variables - X fs X 9519x1 double 1 2 3 4 5 1 -0.4265 2 -0.9564 3 -1.1153 4 -0.5733 -0.9139 5 5 6. -0.8883 7 -0.5448 8 -0.3988 -1.3054 9 10 -1.2250 11 - 1.0113 12 -0.8289 -0.6085 13 14 -0.8161 15 -1.1262
Step by Step Solution
There are 3 Steps involved in it

Get step-by-step solutions from verified subject matter experts