

Question: Please solve Part A and Part B. Show steps pls! The following data show the rate constant of a reaction measured at several different temperatures.
Please solve Part A and Part B. Show steps pls! 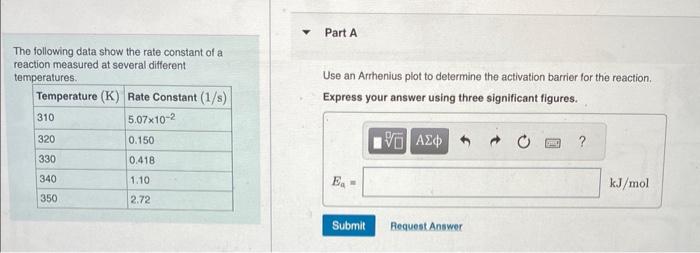
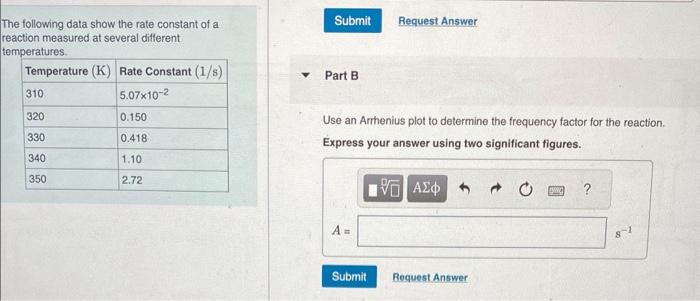
The following data show the rate constant of a reaction measured at several different temperatures. Use an Arrhenius plot to determine the activation barrier for the reaction. Express your answer using three significant figures. The following data show the rate constant of a reaction measured at several different temperatures. Part B Use an Arrhenius plot to determine the frequency factor for the reaction. Express your answer using two significant figures
Step by Step Solution
There are 3 Steps involved in it
1 Expert Approved Answer
Step: 1 Unlock

Question Has Been Solved by an Expert!
Get step-by-step solutions from verified subject matter experts
Step: 2 Unlock
Step: 3 Unlock