Question: Please solve Part C 5. A research team conducted a longitudinal study of participants between 45 and 50 years of age. They measured each participant's

Please solve Part C Please solve Part C 5. A research team conducted
5. A research team conducted a longitudinal study of participants between 45 and 50 years of age. They measured each participant's daily carbohydrate consumption at age 45. They also measured total cholesterol level at age 50. The team collected data on n = 347 participants. The average daily carbohydrate consumption at age 45 was 12.1, with an observed standard deviation of 3.6 (the divisor in the underlying variance calculation was n - 1). The average total cholesterol level at age 50 was 162, with an observed standard deviation of 38.6 (the divisor in the underlying variance calculation was -1). The Pearson product moment correlation coefficient between the two variables was 0.64. The research team seeks to estimate the regression of participant total cholesterol level at age 50 on participant daily carbohydrate consumption at age 45. a. Complete the analysis of variance table for the regression of participant total cholesterol level at age 50 on participant daily carbohydrate consumption at age 45. Test the null hypothesis that the slope of this regression is zero at levels of significance 0.10, 0.05, and 0.01. b. Find the estimated regression of participant total cholesterol level at age 50 on participant daily carbohydrate consumption at age 45. Find the 99% confidence interval for the slope in this equation. c. Use the least-squares equation to estimate a participant's total cholesterol level at age 50 for a participant with daily carbohydrate consumption at age 45 of 20.0. What is the 99% prediction interval for the participant's total cholesterol level at age 50 when the participant has daily carbohydrate consumption at age 45 of 20.0. 5. A research team conducted a longitudinal study of participants between 45 and 50 years of age. They measured each participant's daily carbohydrate consumption at age 45. They also measured total cholesterol level at age 50. The team collected data on n = 347 participants. The average daily carbohydrate consumption at age 45 was 12.1, with an observed standard deviation of 3.6 (the divisor in the underlying variance calculation was n - 1). The average total cholesterol level at age 50 was 162, with an observed standard deviation of 38.6 (the divisor in the underlying variance calculation was -1). The Pearson product moment correlation coefficient between the two variables was 0.64. The research team seeks to estimate the regression of participant total cholesterol level at age 50 on participant daily carbohydrate consumption at age 45. a. Complete the analysis of variance table for the regression of participant total cholesterol level at age 50 on participant daily carbohydrate consumption at age 45. Test the null hypothesis that the slope of this regression is zero at levels of significance 0.10, 0.05, and 0.01. b. Find the estimated regression of participant total cholesterol level at age 50 on participant daily carbohydrate consumption at age 45. Find the 99% confidence interval for the slope in this equation. c. Use the least-squares equation to estimate a participant's total cholesterol level at age 50 for a participant with daily carbohydrate consumption at age 45 of 20.0. What is the 99% prediction interval for the participant's total cholesterol level at age 50 when the participant has daily carbohydrate consumption at age 45 of 20.0

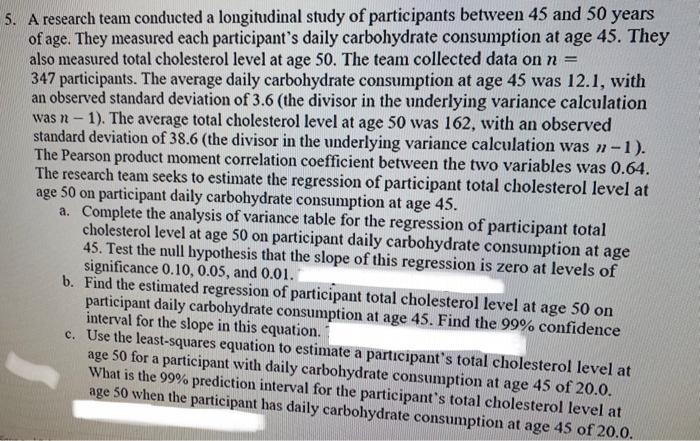
Step by Step Solution

There are 3 Steps involved in it

1 Expert Approved Answer
Step: 1 Unlock blur-text-image
Question Has Been Solved by an Expert!

Get step-by-step solutions from verified subject matter experts

Step: 2 Unlock
Step: 3 Unlock

Students Have Also Explored These Related General Management Questions!