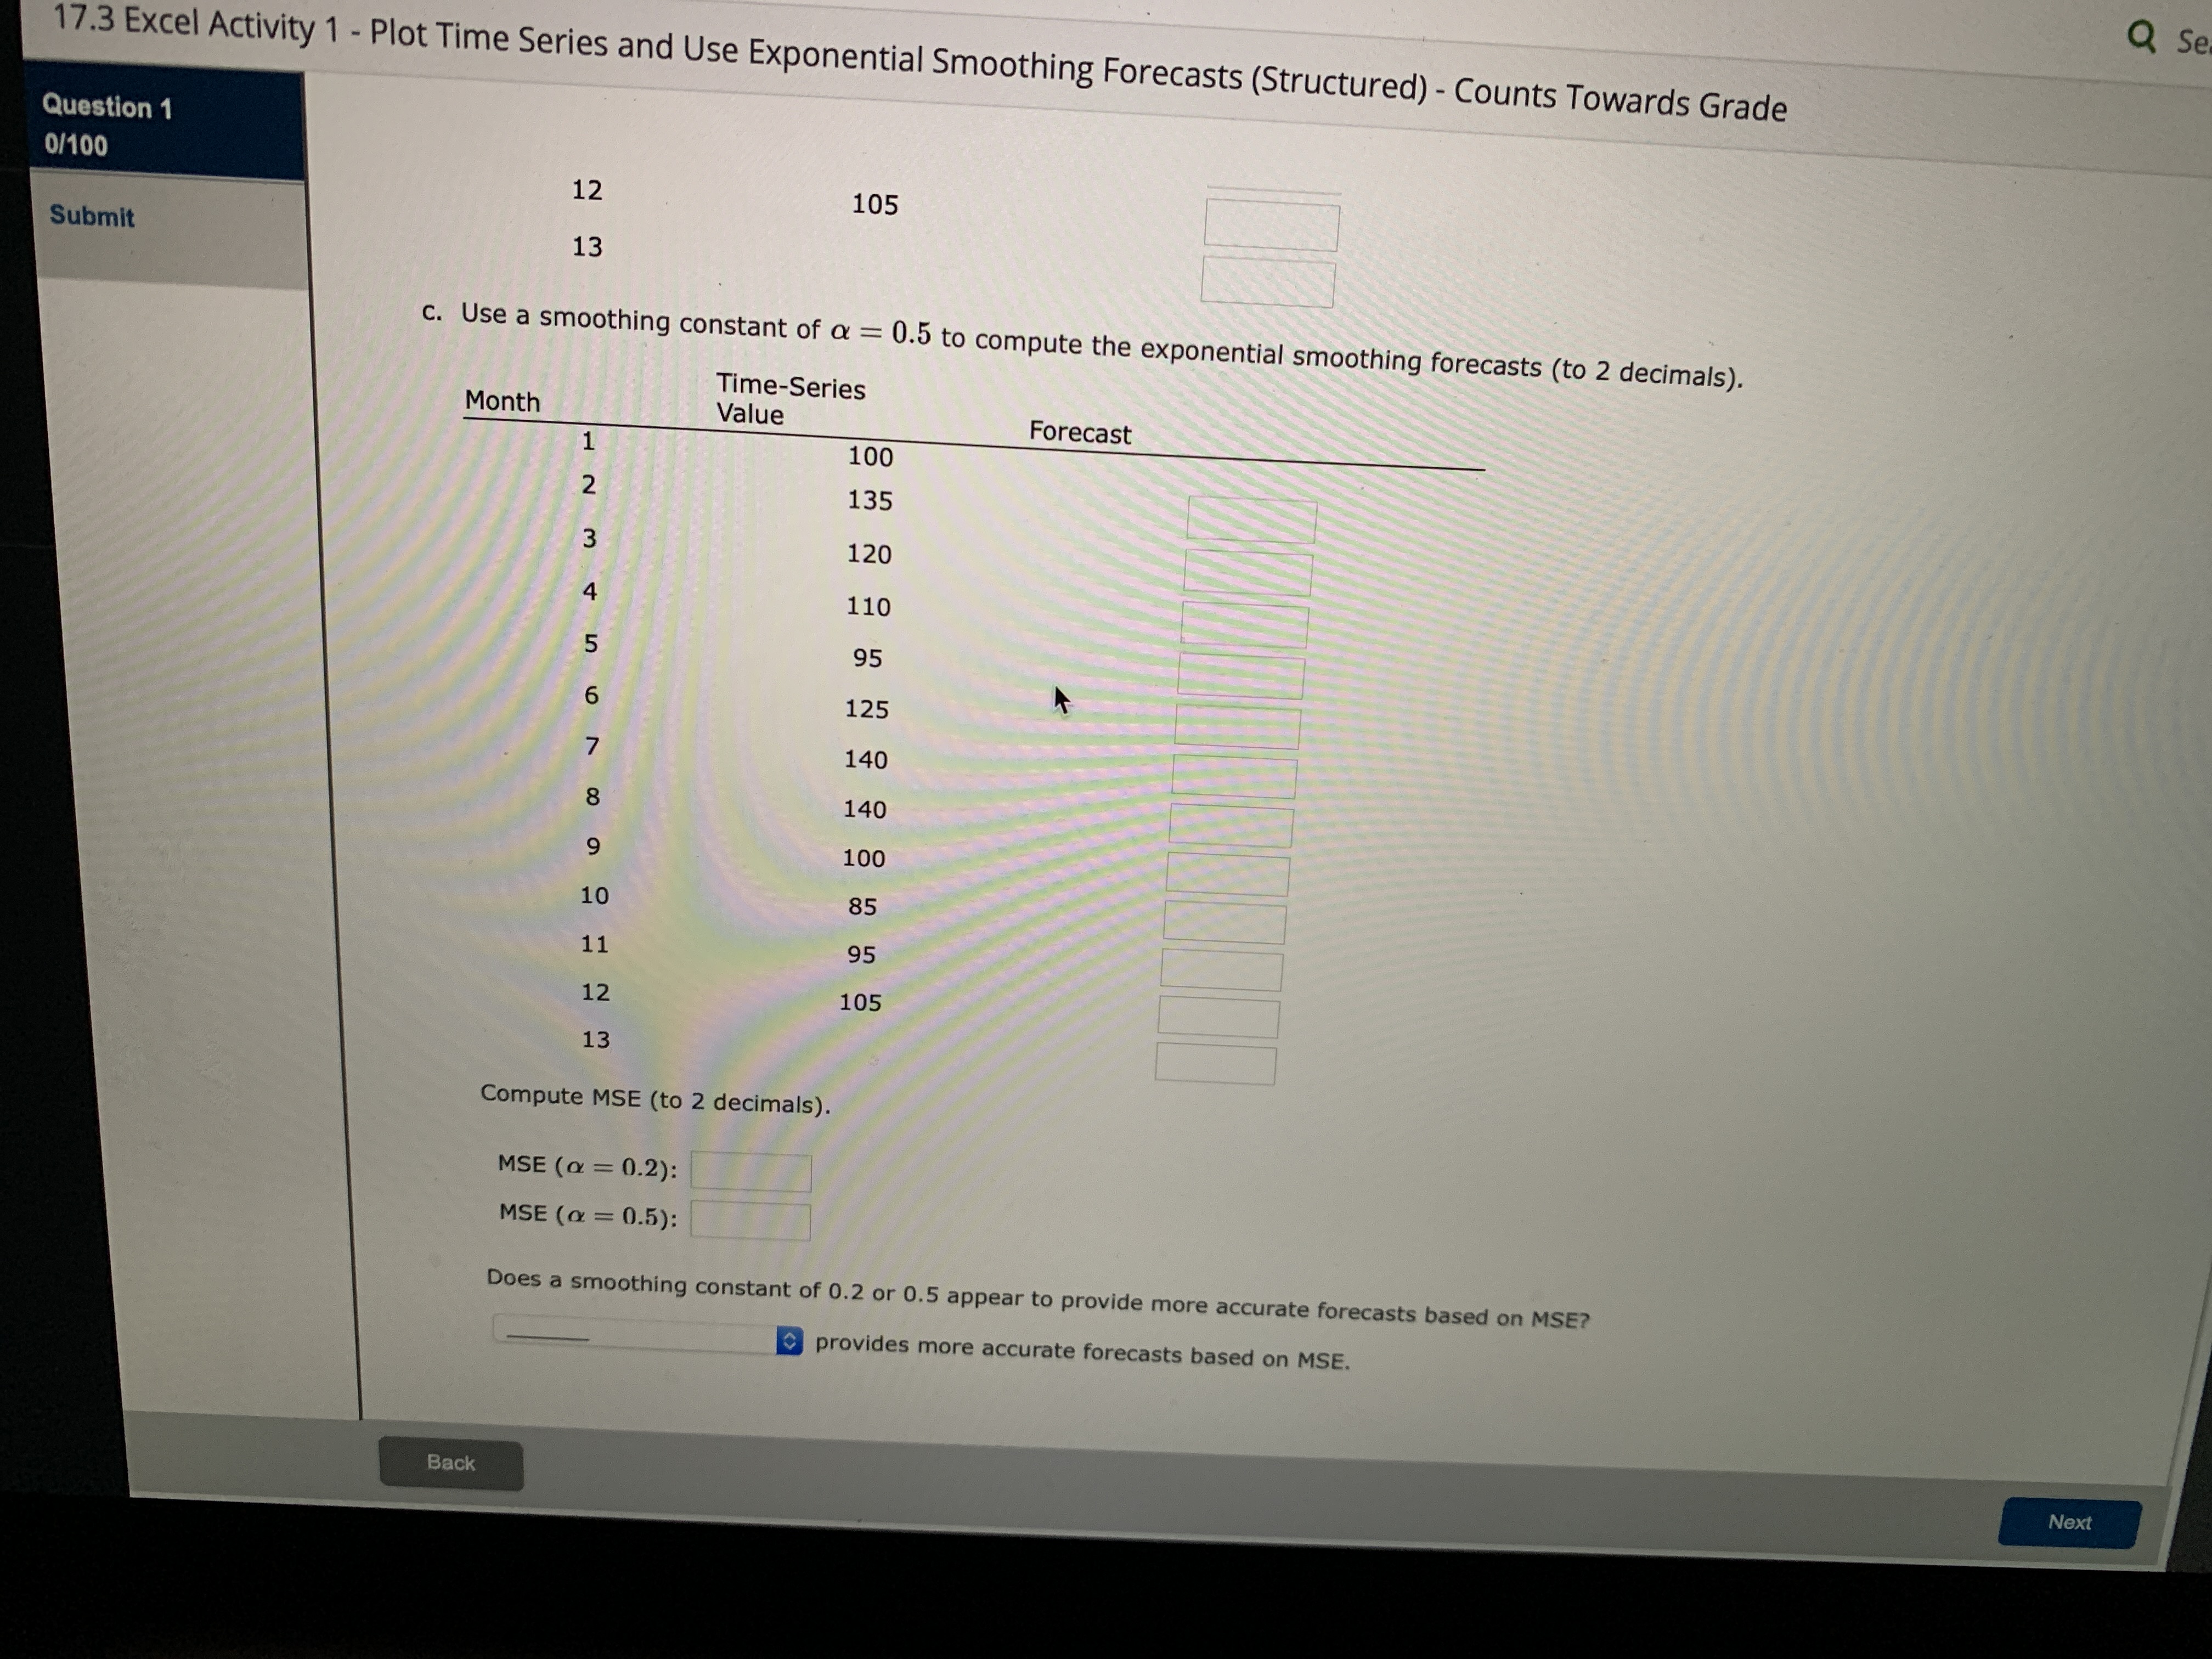
Question: Please solve Q Se 17.3 Excel Activity 1 - Plot Time Series and Use Exponential Smoothing Forecasts (Structured) - Counts Towards Grade Question 1 0/100

Please solve

Please solve Q Se 17.3 Excel Activity 1 - Plot
Q Se 17.3 Excel Activity 1 - Plot Time Series and Use Exponential Smoothing Forecasts (Structured) - Counts Towards Grade Question 1 0/100 12 105 Submit 13 c. Use a smoothing constant of a = 0.5 to compute the exponential smoothing forecasts (to 2 decimals). Time-Series Month Value Forecast 100 135 AWNH 120 110 95 125 6 0 V O UT 140 140 100 10 85 11 95 12 105 12 Compute MSE (to 2 decimals). MSE ( = 0.2): MSE ( = 0.5): Does a smoothing constant of 0.2 or 0.5 appear to provide more accurate forecasts based on MSE? provides more accurate forecasts based on MSE. Back Next

Step by Step Solution

There are 3 Steps involved in it

1 Expert Approved Answer
Step: 1 Unlock blur-text-image
Question Has Been Solved by an Expert!

Get step-by-step solutions from verified subject matter experts

Step: 2 Unlock
Step: 3 Unlock

Students Have Also Explored These Related Mathematics Questions!