

Question: Please solve question 1 and 2. McDonald's Time Line Case Study McDonald's is an American fast food company. founded in [940 as a restaurant operated
Please solve question 1 and 2.
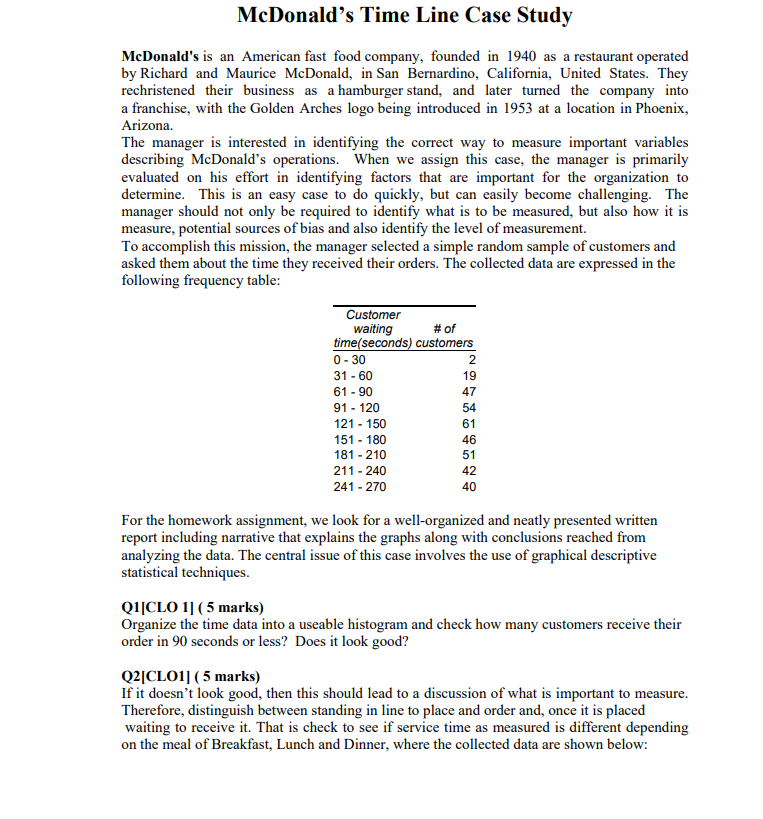
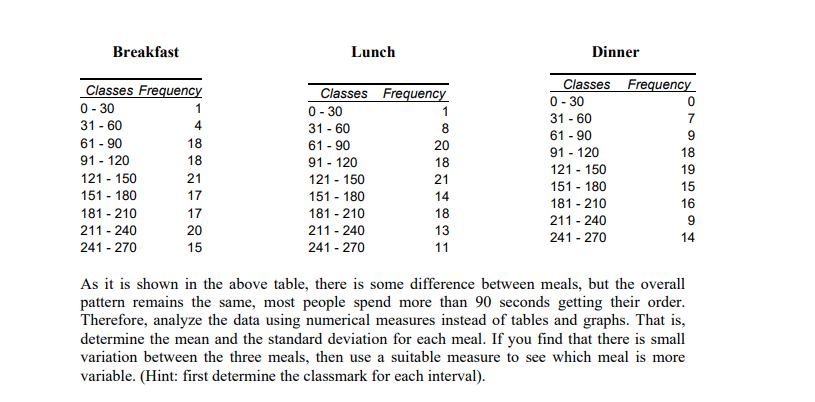

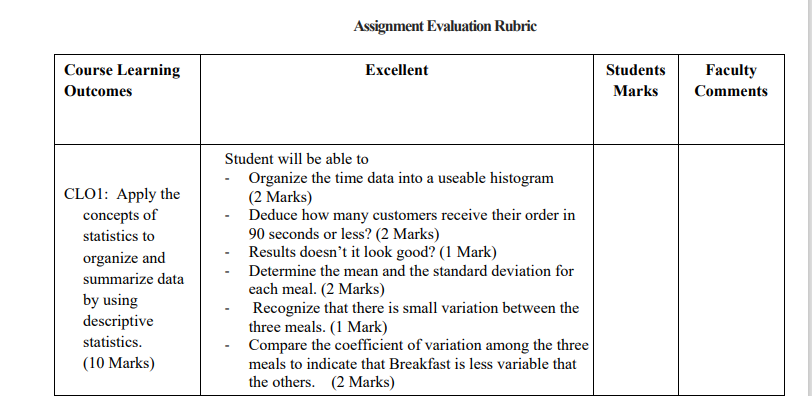
McDonald's Time Line Case Study McDonald's is an American fast food company. founded in [940 as a restaurant operated by Richard and Maurice McDonald. in San Bernardino. California. United States. They rechristened their business as a hamburger stand. and later turned the company into a franchise, with the Golden Arches logo being introduced in 1953 at a location in Phoenix. Arizona. The manager is interested in identifying the correct way to measure important variables describing McDonald's operations. When we assign this case. the manager is primarily evaluated on his effort in identifying factors that are important for the organization to determine. This is an easy case to do quickly. but can easily become challenging. The manager should not only be required to identify what is to be measured. but also hover it is measure. potential sources of bias and also identify the level of measurement. To accomplish this mission. the manager selected a simple random sample of customers and asked them about the time they received their orders. The collected data are expressed in the following frequency table: Customer waiting #of Hmegseeondsl customers [1 - 3t] 2 31 - t] 19 E1 - ED 4? Q1 - 120 54 121 - 150 E1 151 - 130 45 1B1 - 21D 51 211 - 240 42 241 - 2m 40 For the homework assignment. we look for a wellorganized and neatly presented written report including narrative that explains the graphs along with conclusions reached from analyzing the data. The central issue of this case involves the use of graphical descriptive statistical techniques. QIICLU l| { 5 marks] Organize the time data into a useable histogram and check how many customers receive their order in 90 seconds or less? Does it look good? QE|CLUI| I: 5 marks} If it doesn't look good. then this should lead to a discussion of what is important to measure. Therefore. distinguish between standing in line to place and order and. once it is placed waiting to receive it. That is check to see if service time as measured is different depending on the meal of Breakfast. Lunch and Dinner. where the collected data are shown below: Breakfast Lunch Dinner Classes Frequent?! m W 2130 1 q'V-0_3 1 1330 a 4 . 22-22 2 61-90 13 51 '9'] 2\" 911212 12 91-133 13 91 ' 120 13 121 151] 19 121-150 21 121150 21 15143.] 15 151130 1? 151130 14 1312112 16 131210 1? 131210 13 21144.3 9 211240 20 211240 13 2412212 14 241 220 15 241- 220 11 As it is shown in the above table, there is some difference between meals. but the overall pattern remains the same, most people spend more than 9H seconds getting their order. Therefore, analyze the data using numerical measures instead of tables and graphs. That is, determine the mean and the standard deviation for each meal. If you find that there is small variation between the three meals, then use a suitable measure to see which meal is more variable. (Hint: first detemiirle the classmark for each interval]. Assignment Evaluation Rubric Course Learning Excellent Students Faculty Outcomes Marks Comments Student will be able to - Organize the time data into a useable histogram CLO1: Apply the (2 Marks) concepts of Deduce how many customers receive their order in statistics to 90 seconds or less? (2 Marks) organize and Results doesn't it look good? (1 Mark) summarize data Determine the mean and the standard deviation for each meal. (2 Marks) by using Recognize that there is small variation between the descriptive three meals. (1 Mark) statistics. Compare the coefficient of variation among the three (10 Marks) meals to indicate that Breakfast is less variable that the others. (2 Marks)
Step by Step Solution
There are 3 Steps involved in it

Get step-by-step solutions from verified subject matter experts