

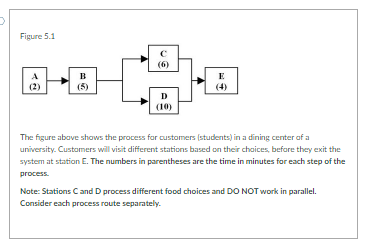
Question: Please solve the below questions using figure 5 . 1 1 . ) Where would you expect student wait times to occur? Group of answer
Please solve the below questions using figure
Where would you expect student wait times to occur?
Group of answer choices
A only
E only
B C and D
D only
Use the information in Figure What is the throughput time for the ABDE process route?
Group of answer choices
minutes
minutes
minutes
minutes
Use the information in Figure What is the throughput time for the ABCE process route?
Group of answer choices
minutes
minutes
minutes
minutes
Use the information in Figure If of the students are routed to C and are routed to D what is the average capacity per hour for the process?
Group of answer choices
student per hour
students per hour
students per hour
students per hour
Use the information in Figure How many Students can be processed through the ABCE routing during a hour session?
Group of answer choices
Use the information in Figure What is the capacity for the ABCE process route?
Group of answer choices
students per hour
students per hour
student per hour
students per hour
Use the information in Figure What is the capacity for the ABDE process route?
Group of answer choices
students per hour
students per hour
student per hour
students per hour
Step by Step Solution
There are 3 Steps involved in it
1 Expert Approved Answer
Step: 1 Unlock

Question Has Been Solved by an Expert!
Get step-by-step solutions from verified subject matter experts
Step: 2 Unlock
Step: 3 Unlock