

Question: Please solve the following problems related to Control chart ( Chapter 3 ) ABC Inc. presents the length in centimeters of one part from the
Please solve the following problems related to Control chart Chapter
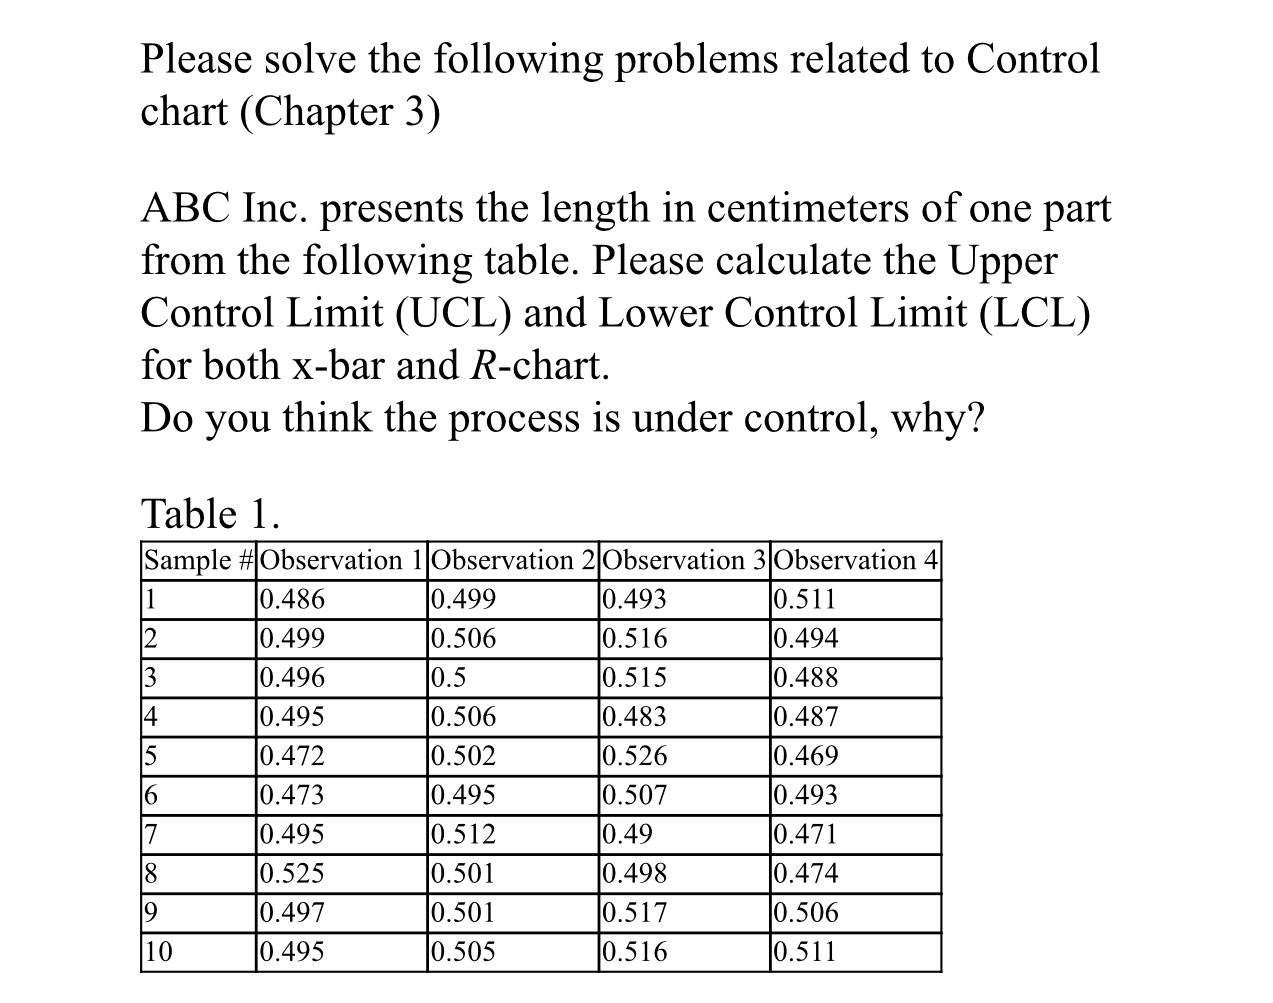
ABC Inc. presents the length in centimeters of one part from the following table. Please calculate the Upper Control Limit UCL and Lower Control Limit LCL for both xbar and chart.
Do you think the process is under control, why?
Table
tableSample #Observation Observation Observation Observation
Step by Step Solution
There are 3 Steps involved in it
1 Expert Approved Answer
Step: 1 Unlock

Question Has Been Solved by an Expert!
Get step-by-step solutions from verified subject matter experts
Step: 2 Unlock
Step: 3 Unlock