

Question: Please solve the following problems step by step with explanation. Q5. Why Principal component analysis technique said as data reduction technique? Q6. The output (from
Please solve the following problems step by step with explanation.
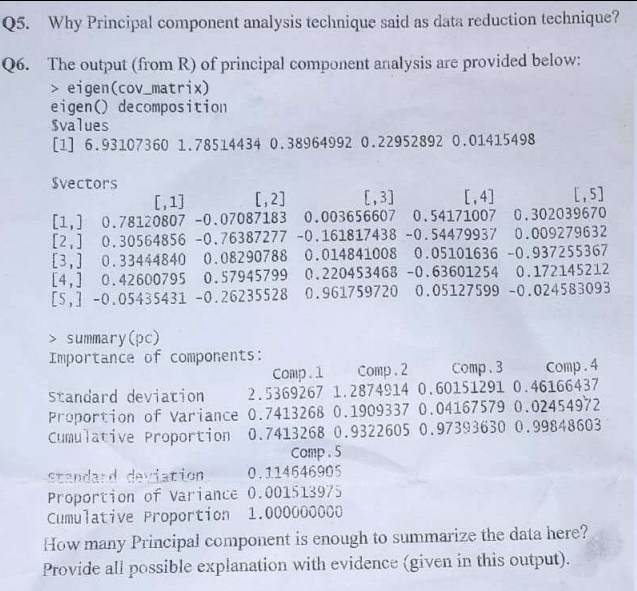
Q5. Why Principal component analysis technique said as data reduction technique? Q6. The output (from R) of principal component analysis are provided below: > eigen (cov_matrix) eigen () decomposition Svalues [1] 6.93107360 1.78514434 0.38964992 0.22952892 0.01415498 Svectors [, 1] [, 2] [, 3] [, 4] [, 5] [1, ] 0.78120807 -0.07087183 0. 003656607 0. 54171007 0.302039670 [2,] 0. 30564856 -0.76387277 -0.161817438 -0.54479937 0.009279632 [3, ] 0. 33444840 0.08290788 0.014841008 0.05101636 -0.937255367 [4,] 0. 42600795 0.57945799 0.220453468 -0.63601254 0. 172145212 [5, ] -0.05435431 -0.26235528 0. 961759720 0.05127599 -0.024583093 > summary (pc) Importance of components: Comp . 1 Comp . 2 Comp . 3 Comp . 4 standard deviation 2. 5369267 1. 2874914 0. 60151291 0.46166437 Proportion of Variance 0. 7413268 0.1909337 0.04167579 0.02454972 cumulative Proportion 0. 7413268 0.9322605 0.97393630 0.99848603 Comp . 5 standard deviation 0. 114646905 Proportion of Variance 0. 001513975 Cumulative Proportion 1.000000000 How many Principal component is enough to summarize the data here? Provide all possible explanation with evidence (given in this output)
Step by Step Solution
There are 3 Steps involved in it

Get step-by-step solutions from verified subject matter experts