

Question: Please solve the following questions using EXCEL and what EXCEL formula you used! Using the information above, record the resulting portfolio standard deviation in the
Please solve the following questions using EXCEL and what EXCEL formula you used!
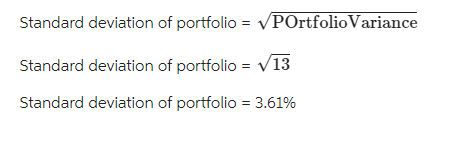
Using the information above, record the resulting portfolio standard deviation in the table below as well.
Also compute the portfolio mean return, which is the weighted average of the individual asset's mean return, and record it in the table below.
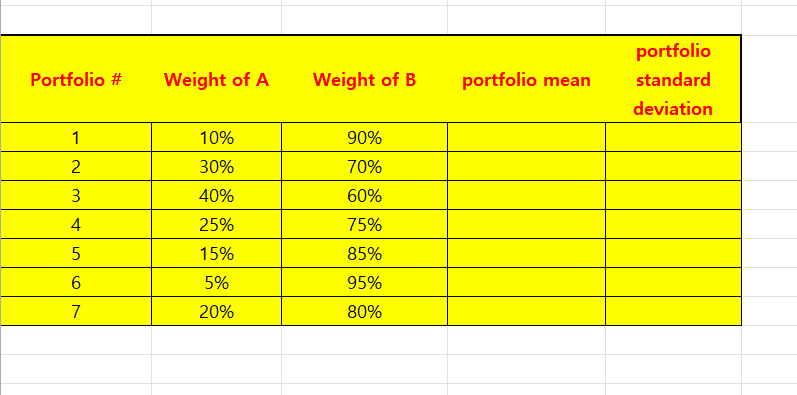
Using the numbers that you solved from the yellow chart, please find x-axis, y-axis, and create a graph showing the investment opportunity set.
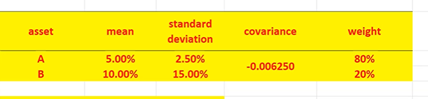
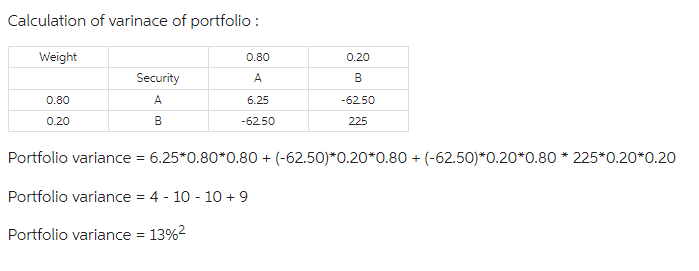
\begin{tabular}{|ccccc} asset & mean & standard deviation & covariance & weight \\ \hline A & 5.00% & 2.50% & 0.006250 & 80% \\ B & 10.00% & 15.00% & & 20% \end{tabular} Calculation of varinace of portfolio: Portfolio variance =6.250.800.80+(62.50)0.200.80+(62.50)0.200.802250.200.20 Portfolio variance =41010+9 Portfolio variance =13%2 Standard deviation of portfolio =POrtfolioVariance Standard deviation of portfolio =13 Standard deviation of portfolio =3.61% x-axis y-axis investmetn opportunity set here
Step by Step Solution
There are 3 Steps involved in it

Get step-by-step solutions from verified subject matter experts