

Question: Please solve The following table (the data is provided in question 1 of Assignment 4) gives some data on a shell measurement (the length of
Please solve
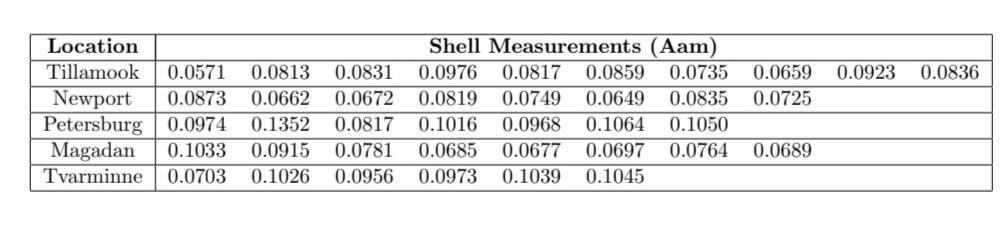
The following table (the data is provided in question 1 of Assignment 4) gives some data on a shell measurement (the length of the anterior adductor muscle scar, standardized by dividing by length; call this "AAM length") in the mussel Mytilus trossulus from five locations. Test at 0.5% significance level whether the mean of these shell measurements are equal in the different locations. assignment 4 table1.pdf (a) The test statistic is (b) The p-value of the test is (c) The critical value of the test isLocation Shell Measurements (Aam) Tillamook 0.0571 0.0813 0.0831 0.0976 0.0817 0.0859 0.0735 0.0659 0.0923 0.0836 Newport 0.0873 0.0662 0.0672 0.0819 0.0749 0.0649 0.0835 0.0725 Petersburg 0.0974 0.1352 0.0817 0.1016 0.0968 0.1064 0.1050 Magadan 0.1033 0.0915 0.0781 0.0685 0.0677 0.0697 0.0764 0.0689 Tvarminne 0.0703 0.1026 0.0956 0.0973 0.1039 0.1045
Step by Step Solution
There are 3 Steps involved in it

Get step-by-step solutions from verified subject matter experts