

Question: please solve the incorrect ones 3. [0.21/0.33 Points] DETAILS PREVIOUS ANSWERS BBUNDERSTAT12 9.1.013.MI.NVA MY NOTES ASK YOUR TEACHER PRACTICE ANOTHER How much should a healthy
please solve the incorrect ones
![please solve the incorrect ones 3. [0.21/0.33 Points] DETAILS PREVIOUS ANSWERS BBUNDERSTAT12](https://dsd5zvtm8ll6.cloudfront.net/si.experts.images/questions/2024/10/6703ef25bc943_0776703ef258a2ca.jpg)
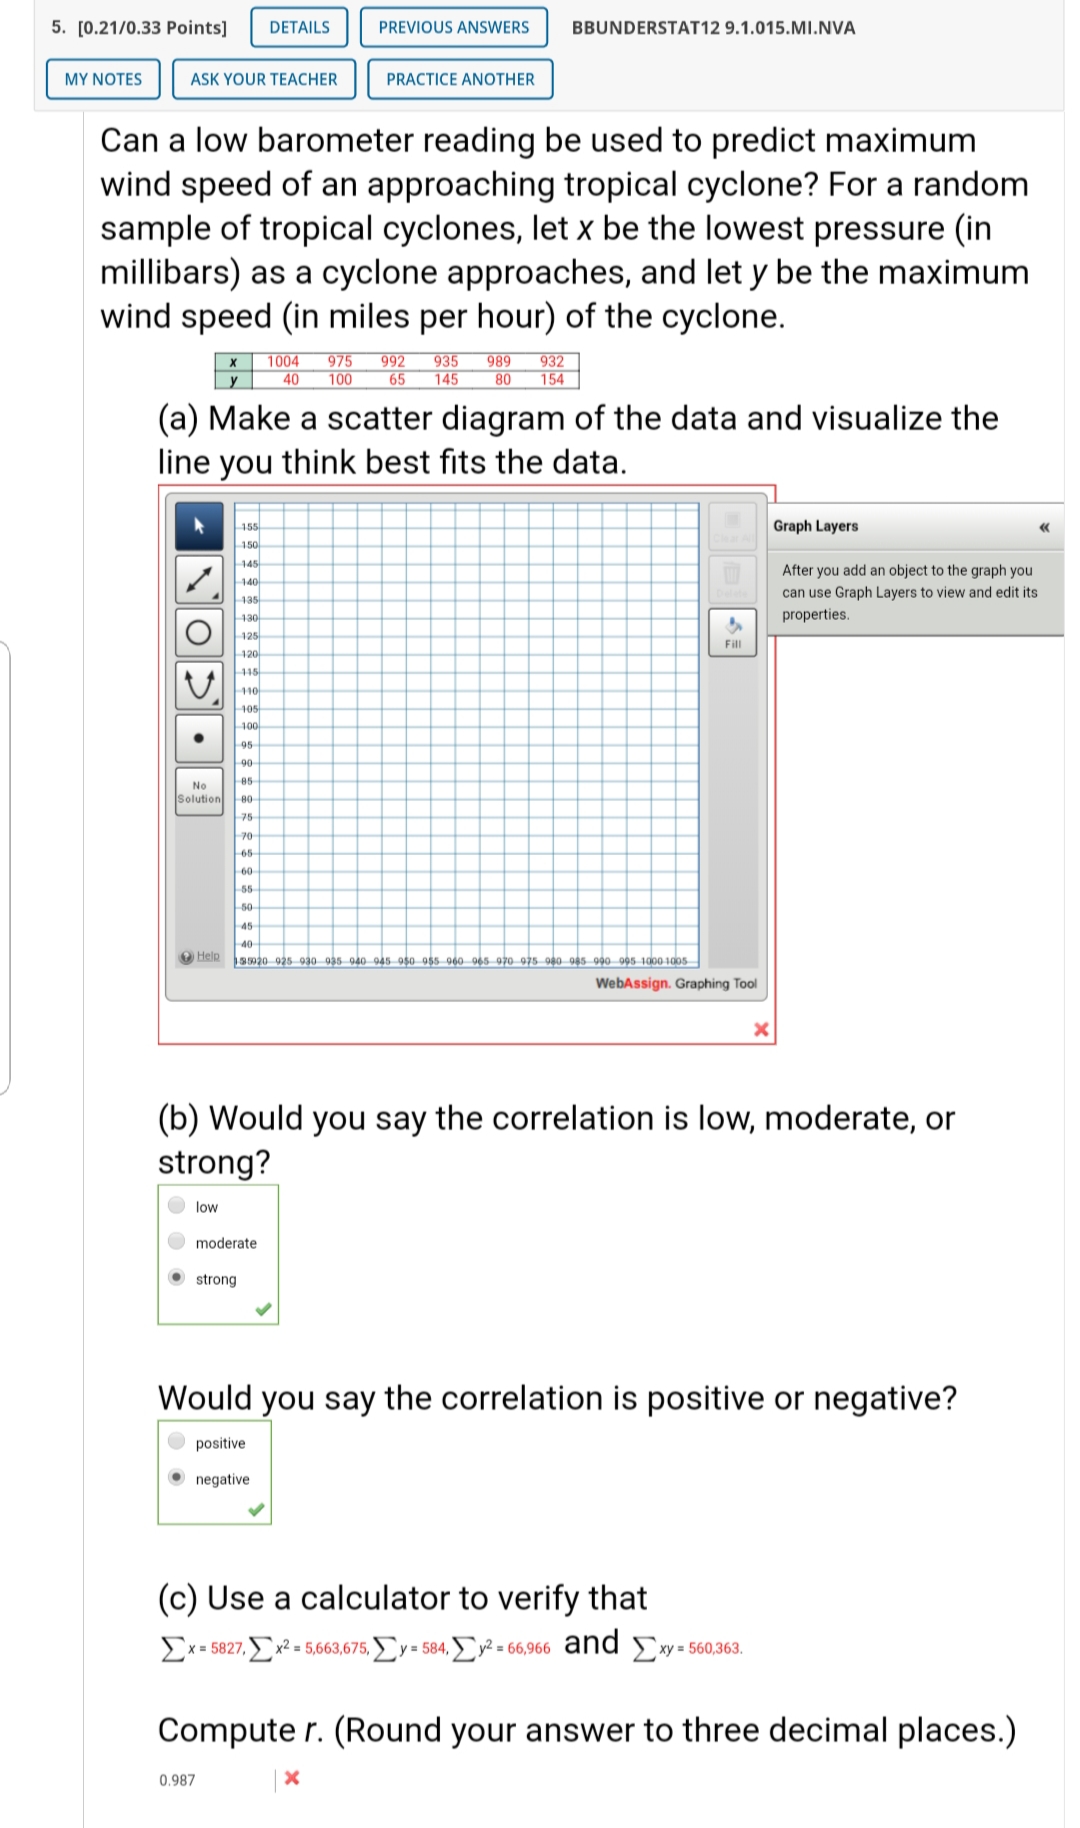
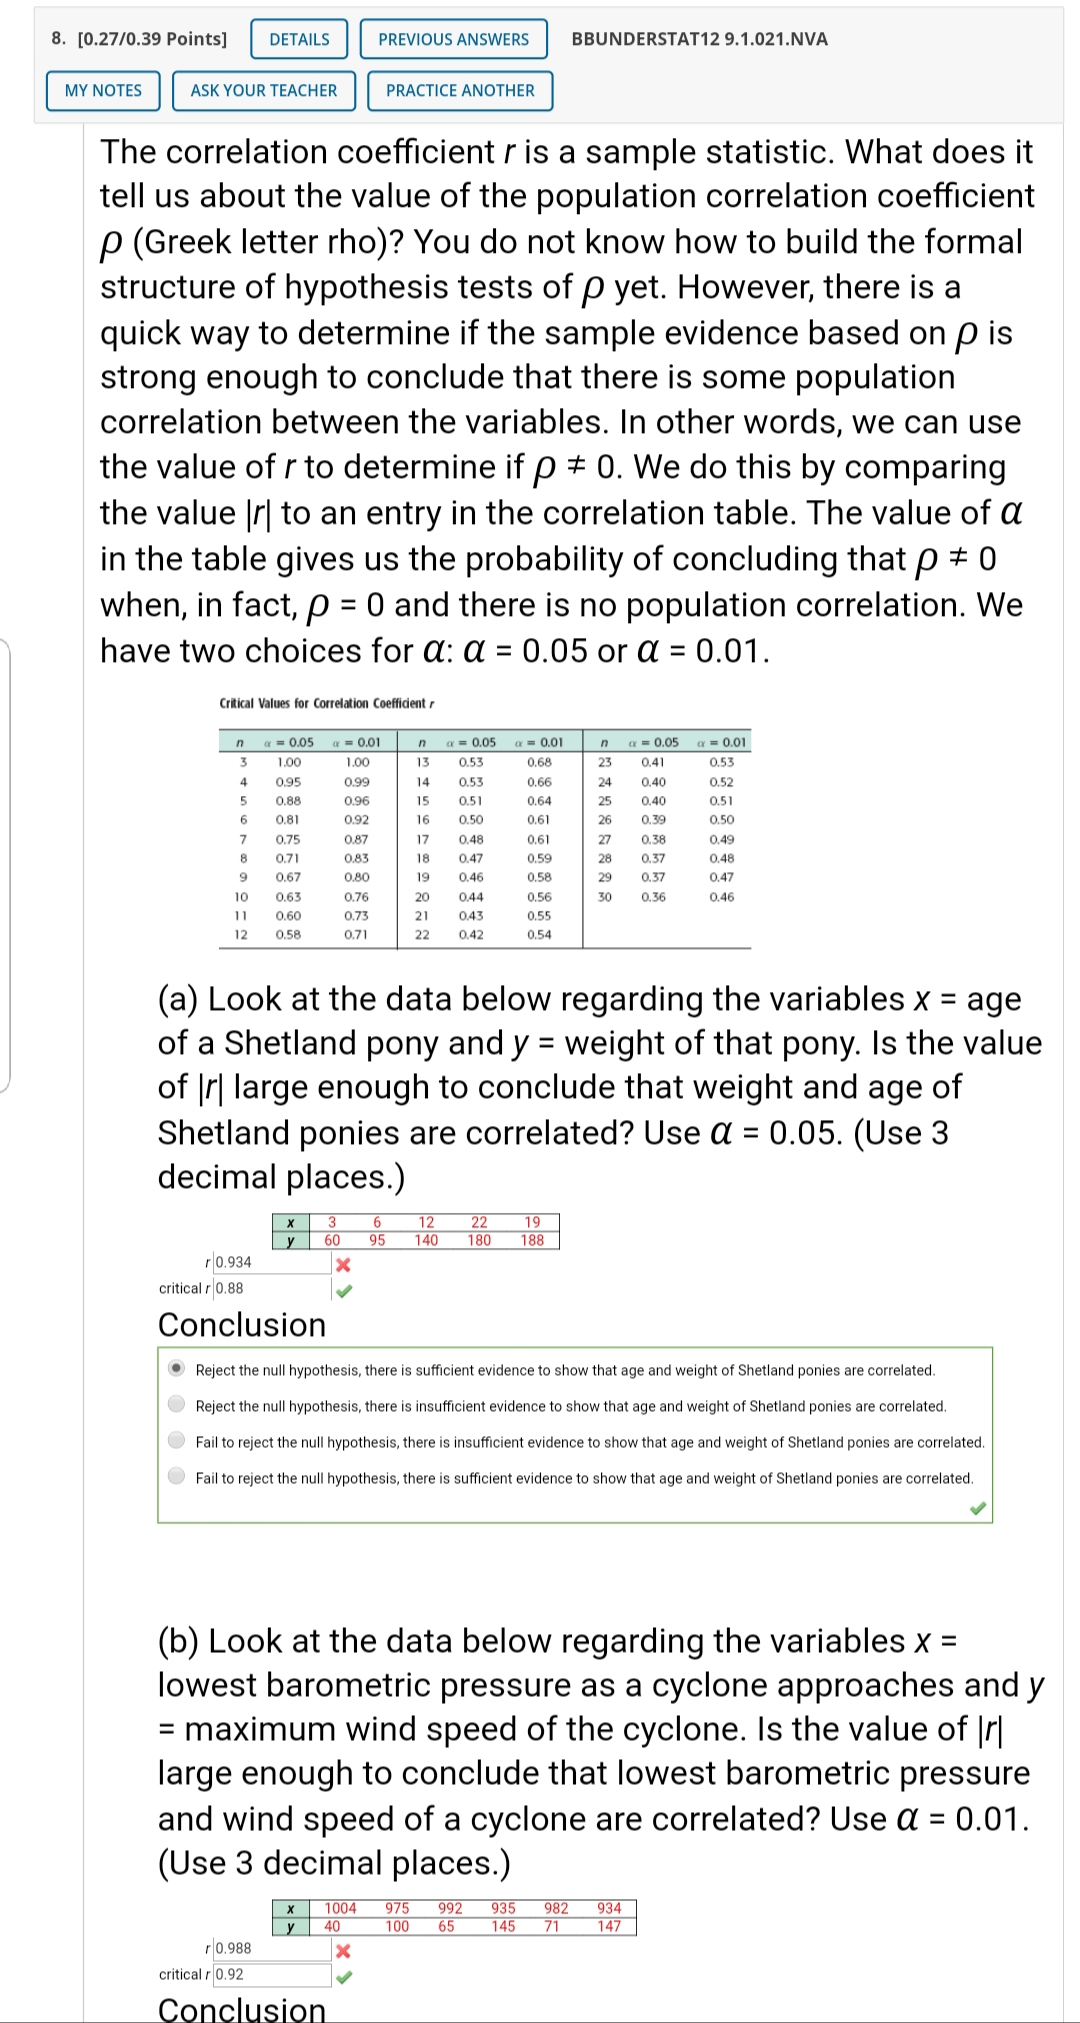
3. [0.21/0.33 Points] DETAILS PREVIOUS ANSWERS BBUNDERSTAT12 9.1.013.MI.NVA MY NOTES ASK YOUR TEACHER PRACTICE ANOTHER How much should a healthy Shetland pony weigh? Let x be the age of the pony (in months), and let y be the average weight of the pony (in kilograms). 80 95 140 164 (a) Make a scatter diagram of the data and visualize the line you think best fits the data. 190 Graph Layers 180 170 After you add an object to the graph you can use Graph Layers to view and edit its O 160 properties. 150 Fill V 140 130 120 110 No Solution 100 90 60 Help WebAssign. Graphing Tool (b) Would you say the correlation is low, moderate, or strong? low moderate .strong Would you say the correlation is positive or negative? positive negative (c) Use a calculator to verify that _x= 60, _x2= 962, _y= 648, Ly = 94,842, and Exy= 9,376. Computer. (Round your answer to three decimal places.) 0.974 X5. [0.21/0.33 Points] DETAILS PREVIOUS ANSWERS BBUNDERSTAT12 9.1.015.MI.NVA MY NOTES ASK YOUR TEACHER PRACTICE ANOTHER Can a low barometer reading be used to predict maximum wind speed of an approaching tropical cyclone? For a random sample of tropical cyclones, let x be the lowest pressure (in millibars) as a cyclone approaches, and let y be the maximum wind speed (in miles per hour) of the cyclone. 1004 975 40 100 992 65 935 145 989 80 932 154 (a) Make a scatter diagram of the data and visualize the line you think best fits the data. Graph Layers After you add an object to the graph you can use Graph Layers to view and edit its O properties. Fill V -405 100 No Solution Help 85920-925 930-925 940 945 950 955 960 965 970 975-980 985 890-995-1800-1805 WebAssign. Graphing Tool X (b) Would you say the correlation is low, moderate, or strong? low moderate strong Would you say the correlation is positive or negative? positive .negative (c) Use a calculator to verify that [x= 5827, ) x2 - 5,663,675, _y= 584, ) y2 = 66,966 and _ xy = 560,363. Computer. (Round your answer to three decimal places.) 0.987 X8. [0.27/0.39 Points] DETAILS PREVIOUS ANSWERS BBUNDERSTAT12 9.1.021.NVA MY NOTES ASK YOUR TEACHER PRACTICE ANOTHER The correlation coefficient r is a sample statistic. What does it tell us about the value of the population correlation coefficient p (Greek letter rho)? You do not know how to build the formal structure of hypothesis tests of p yet. However, there is a quick way to determine if the sample evidence based on p is strong enough to conclude that there is some population correlation between the variables. In other words, we can use the value of r to determine if p # 0. We do this by comparing the value to an entry in the correlation table. The value of a in the table gives us the probability of concluding that p * 0 when, in fact, p = 0 and there is no population correlation. We have two choices for a: a = 0.05 or a = 0.01. Critical Values for Correlation Coefficient r n & = 0.05
Step by Step Solution
There are 3 Steps involved in it

Get step-by-step solutions from verified subject matter experts