

Question: Please Solve the Question as shown in the Image and put screenshot of Excel Sheet in answer Problem 2 :Given the information Part 1 -
Please Solve the Question as shown in the Image and put screenshot of Excel Sheet in answer
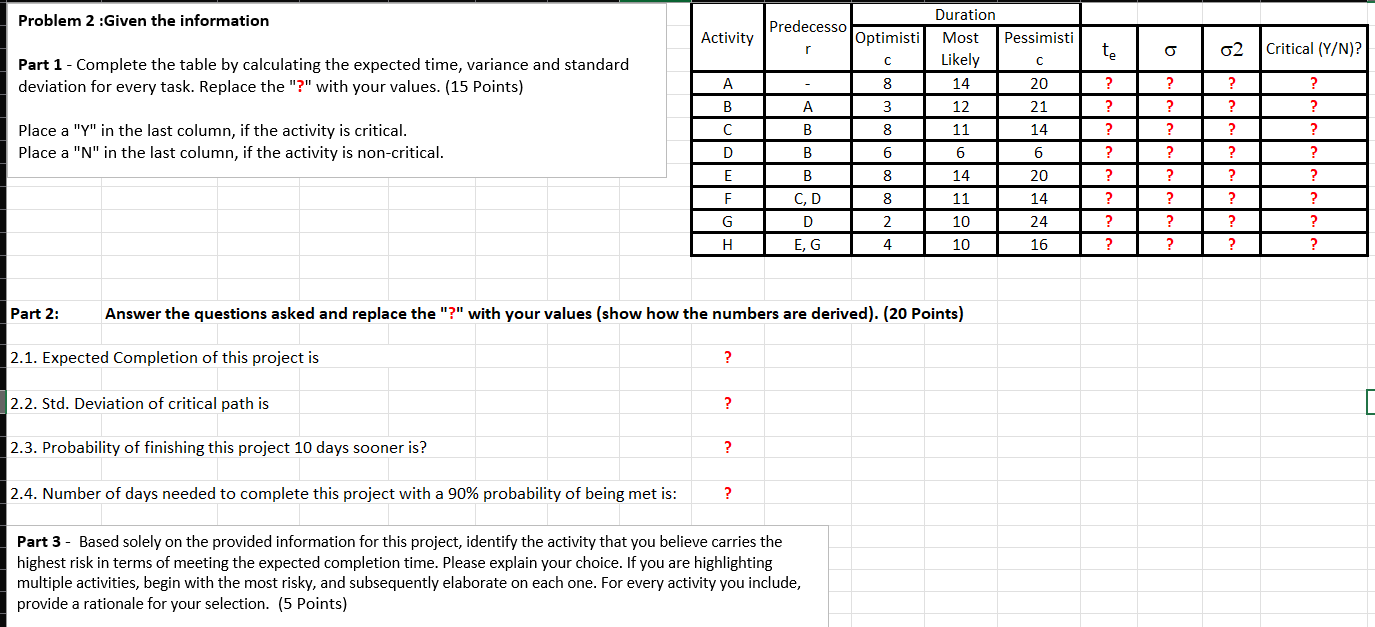
Problem :Given the information
Part Complete the table by calculating the expected time, variance and standard deviation for every task. Replace the with your values. Points
Place a Y in the last column, if the activity is critical.
Place a N in the last column, if the activity is noncritical.
Part : Answer the questions asked and replace the with your values show how the numbers are derived Points
Expected Completion of this project is
Std Deviation of critical path is
Probability of finishing this project days sooner is
Number of days needed to complete this project with a probability of being met is:
Part Based solely on the provided information for this project, identify the activity that you believe carries the highest risk in terms of meeting the expected completion time. Please explain your choice. If you are highlighting multiple activities, begin with the most risky, and subsequently elaborate on each one. For every activity you include, provide a rationale for your selection. PointsPart : Answer the questions asked and replace the with your values show how the numbers are derived Points
Step by Step Solution
There are 3 Steps involved in it
1 Expert Approved Answer
Step: 1 Unlock

Question Has Been Solved by an Expert!
Get step-by-step solutions from verified subject matter experts
Step: 2 Unlock
Step: 3 Unlock