

Question: please solve The scatter plot shows the relationship between the number of coffee drinks sold and the total expenses of a coffee shop. 1 I
please solve
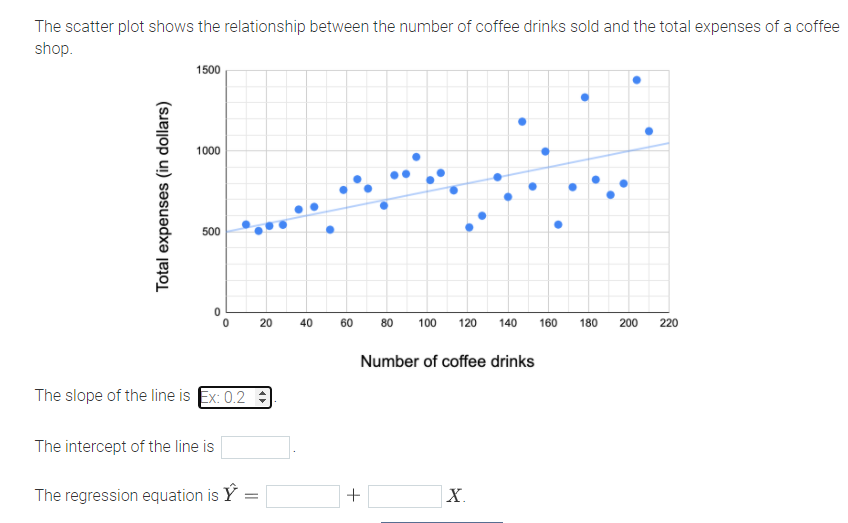
The scatter plot shows the relationship between the number of coffee drinks sold and the total expenses of a coffee shop. 1\" I H . E g ' ' 1} 1000 I. .- _ _._ s - ' Lu-I' '. . ' g l.. _. I.\" . I I ... C .+.' i g g m ..l. . . ' :3 a mmmmmmmmmmm Numbarofooffaadrinks The slope of the line is -_ The intercept ofthe line is The regression equation is 13' = + X
Step by Step Solution
There are 3 Steps involved in it
1 Expert Approved Answer
Step: 1 Unlock

Question Has Been Solved by an Expert!
Get step-by-step solutions from verified subject matter experts
Step: 2 Unlock
Step: 3 Unlock