

Question: Please solve these question. the graph that they are referring to is right here as well Use StatCrunch to conduct a 1 sample t-test to
Please solve these question. the graph that they are referring to is right here as well
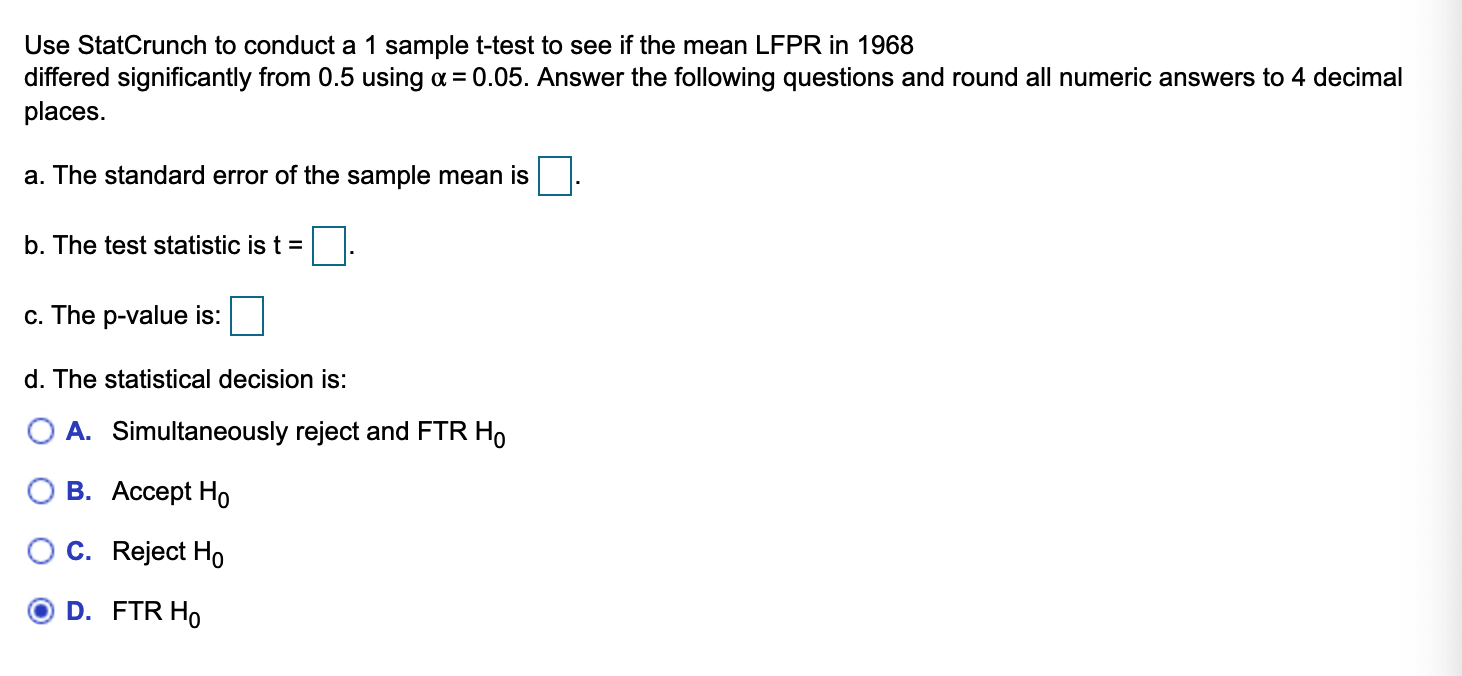
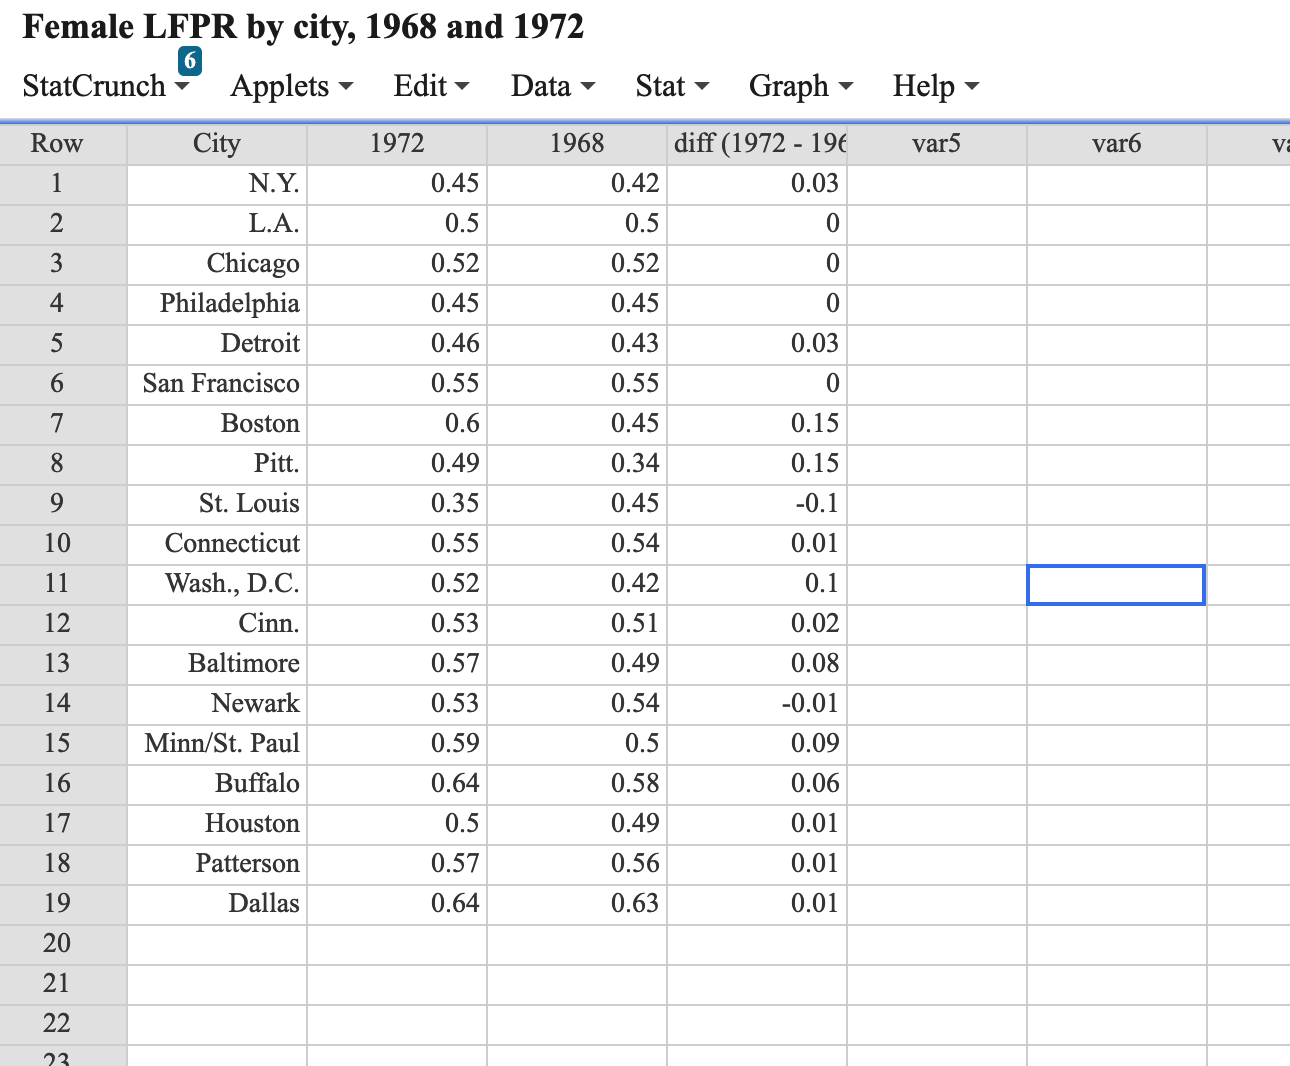
Use StatCrunch to conduct a 1 sample t-test to see if the mean LFPR in 1968 differed significantly from 0.5 using a = 0.05. Answer the following questions and round all numeric answers to 4 decimal places. a. The standard error of the sample mean is b. The test statistic is t = c. The p-value is: d. The statistical decision is: O A. Simultaneously reject and FTR Ho O B. Accept Ho O C. Reject Ho D. FTR HOFemale LFPR by city, 1968 and 1972 StatCrunch 6 Applets ~ Edit Data - Stat . Graph . Help Row City 1972 1968 diff (1972 - 196 var5 var6 N.Y. 0.45 0.42 0.03 L.A. 0.5 0.5 0 W N Chicago 0.52 0.52 O Philadelphia 0.45 0.45 0 U D Detroit 0.46 0.43 0.03 San Francisco 0.55 0.55 0 J a Boston 0.6 0.45 0.15 Pitt. 0.49 0.34 0.15 St. Louis 0.35 0.45 -0.1 10 Connecticut 0.55 0.54 0.01 11 Wash., D.C. 0.52 0.42 0.1 12 Cinn. 0.53 0.51 0.02 13 Baltimore 0.57 0.49 0.08 14 Newark 0.53 0.54 -0.01 15 Minn/St. Paul 0.59 0.5 0.09 16 Buffalo 0.64 0.58 0.06 17 Houston 0.5 0.49 0.01 18 Patterson 0.57 0.56 0.01 19 Dallas 0.64 0.63 0.01 20 21 22
Step by Step Solution
There are 3 Steps involved in it

Get step-by-step solutions from verified subject matter experts