

Question: please solve this. 4. Four histograms are displayed below. These histograms are labelled, in order from top to bottom, Histogram A, Histogram B, Histogram C

please solve this.
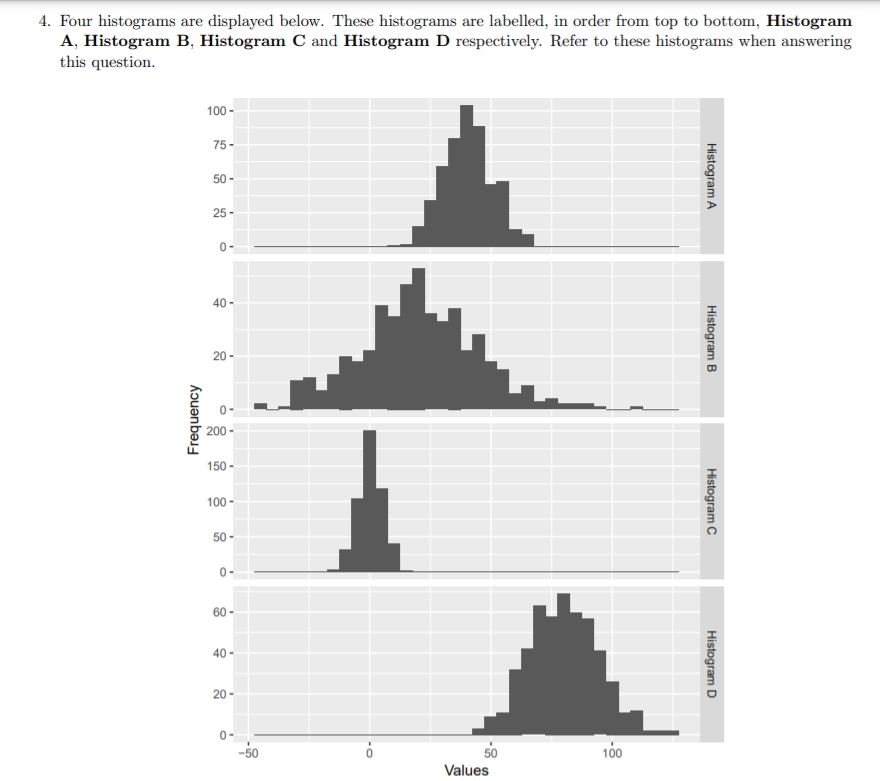
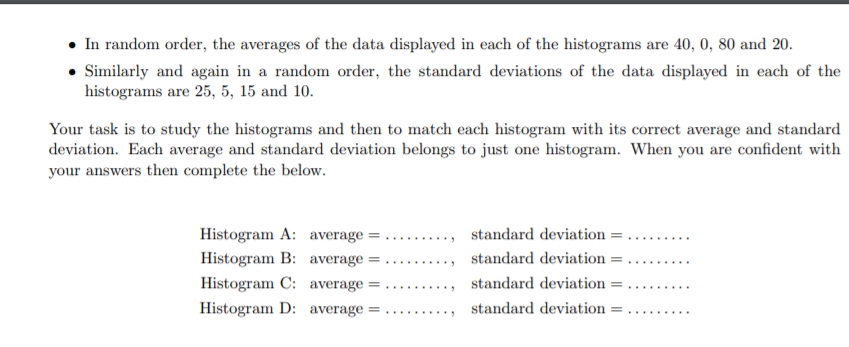
4. Four histograms are displayed below. These histograms are labelled, in order from top to bottom, Histogram A, Histogram B, Histogram C and Histogram D respectively. Refer to these histograms when answering this question. 100 - 75- 50 - Histogram A 25 - 0- 40- Histogram B 20- 0 Frequency 200 - 150 - 100 - Histogram C 50 - 60 - 40 - Histogram D 20 - 0- -50 50 100 Valueso In random order, the averages of the data displayed in each of the histograms are 40, {1, BIZ! and 20. e Similarly and again in a random order. the standard deviations of the data displayed in each of the histograms are 25. 5, 15 and 10. Your task is to study the histograms and then to match each histogram with its correct average and standard deviation. Each average and standard deviation belongs to just one histogram. When you are oondent with your answers then oompiete the below. Histogram A: average = ......... , standard deviation = ......... Histogram B: average = ......... , standard deviation = ......... Histogram C: average = ......... , standard deviation = ......... Histogram D: average = ......... , standard deviation =
Step by Step Solution
There are 3 Steps involved in it

Get step-by-step solutions from verified subject matter experts