

Question: please solve this for me The following data shows the weekly income of workers Weekly Income($) 35-39 40-44 45-49 50-54 55-59 60-64 65-69 70-74 No.
please solve this for me
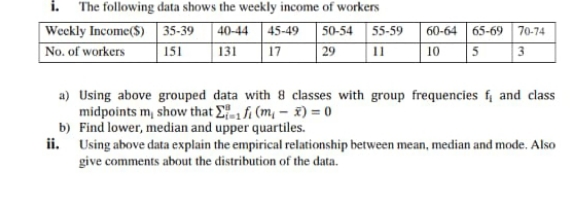
The following data shows the weekly income of workers Weekly Income($) 35-39 40-44 45-49 50-54 55-59 60-64 65-69 70-74 No. of workers 151 131 17 29 11 10 a) Using above grouped data with 8 classes with group frequencies f, and class midpoints m, show that ) _, f, (m, - 2) = 0 b) Find lower, median and upper quartiles. ii. Using above data explain the empirical relationship between mean, median and mode. Also give comments about the distribution of the data
Step by Step Solution
There are 3 Steps involved in it
1 Expert Approved Answer
Step: 1 Unlock

Question Has Been Solved by an Expert!
Get step-by-step solutions from verified subject matter experts
Step: 2 Unlock
Step: 3 Unlock