

Question: Please solve this problem in Minitab and show all your steps and solutions. 6- Data: Excel File named Control Chart 1 showing results of
Please solve this problem in Minitab and show all your steps and solutions. 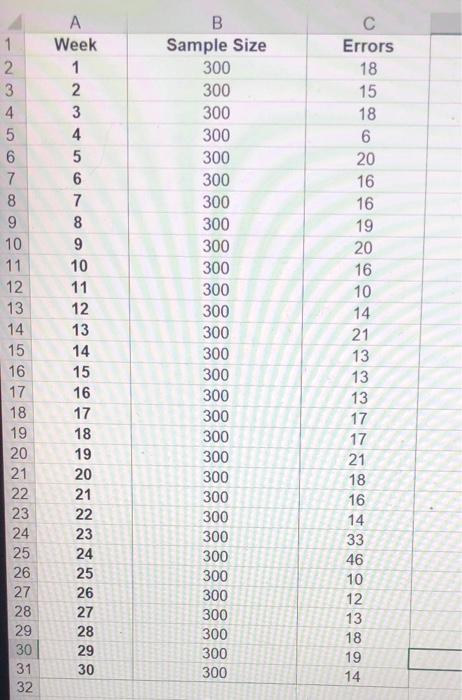
6- Data: Excel File named "Control Chart 1 " showing results of randomly selected weekly samples taken from transactions completed in an insurance daims processing department. The column "errors" reflects how many transactions in the sample contain at least one error. Build an appropriate control chart for this data. Tune MINITAB to check for all possible abnormalities in the control chart. Analyze the results
Step by Step Solution
There are 3 Steps involved in it
1 Expert Approved Answer
Step: 1 Unlock

Question Has Been Solved by an Expert!
Get step-by-step solutions from verified subject matter experts
Step: 2 Unlock
Step: 3 Unlock