

Question: Please solve this question I want to solve this question on the attached tables Analyzing a company for Its Investment Potential In its annual report,
Please solve this question
I want to solve this question on the attached tables
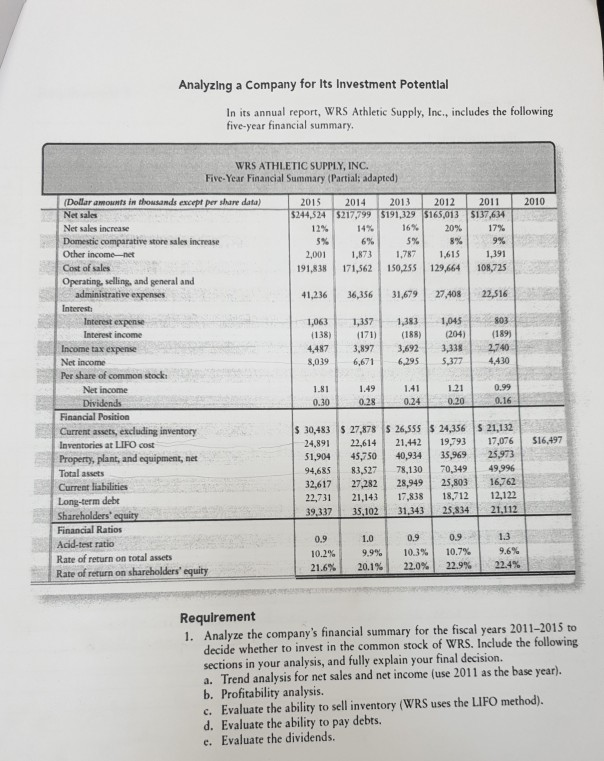
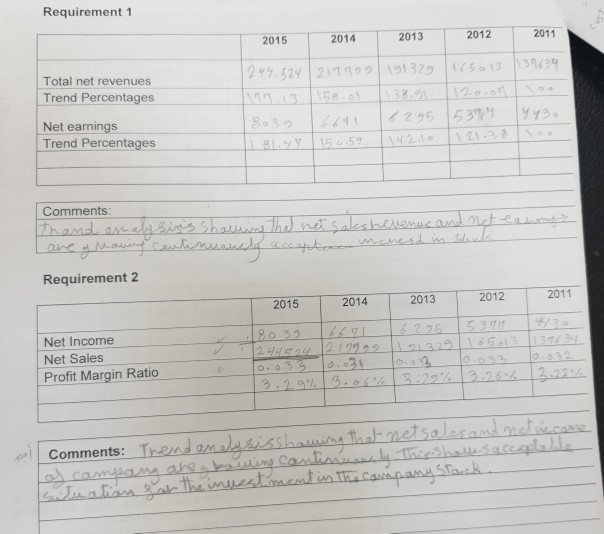
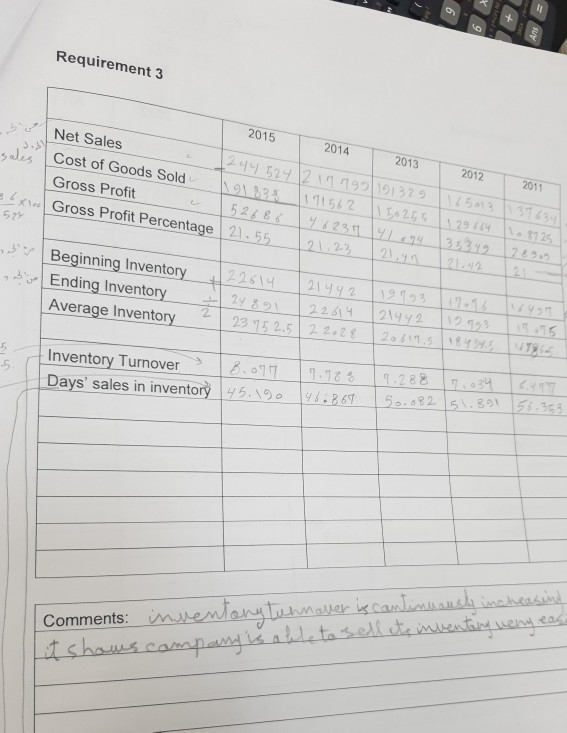
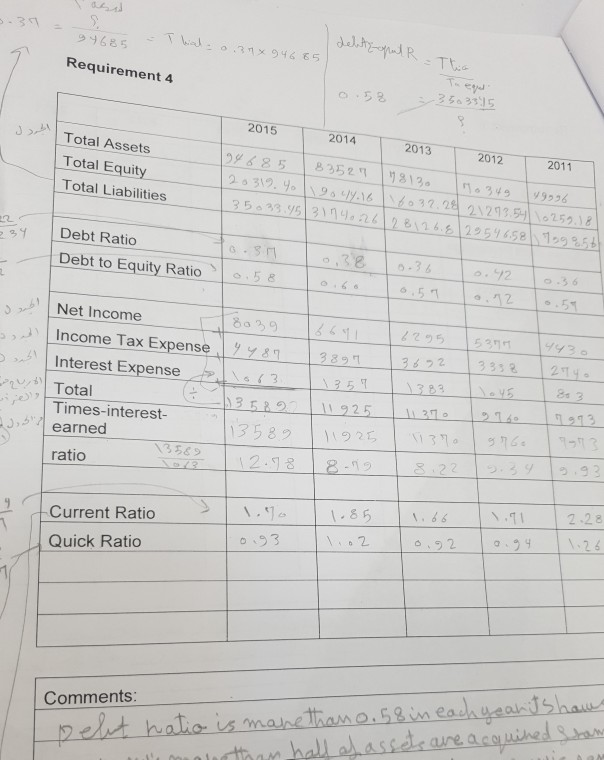
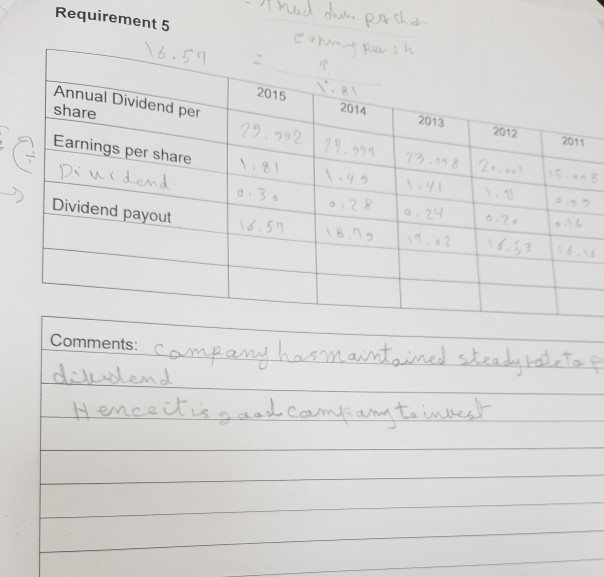
Analyzing a company for Its Investment Potential In its annual report, WRS Athletic Supply, Inc., includes the following five-year financial summary. WRS ATHLETIC SUPPLY, INC. Five-Year Financial Summary (Partial; adapted) 2010 2015 5244,524 2011 5137634 17% 2014 2013 2012 5217799 $191,329 5165,013 16% 20% 6% 5% 1,873 1,787 1,615 171,562 150,255 129,664 9% 2,001 191,838 1.191 108,725 41,236 36,356 31.679 27.408 22,516 1,383 (188) 1,063 (138) 4,487 8,039 1,337 (171) 3,897 6,671 1,045 (204) 3,338 5,377 803 (189) 2,740 4430 3,692 6,295 (Dollar amount in thousands except per share data) Net sales Net sales increase Domestic comparative store sales increase Other income-net Cost of sales Operating, selling, and general and administrative expenses Interest Interest expense Interest income Income tax expense Net income Por share of common stock Net income Dividends Financial Position Current assets, excluding inventory Inventories at LIFO cost Property, plant, and equipment, net Total assets Current liabilities Long-term debe Shareholderseguiry Financial Ratios Acid-test ratio Rate of return on total assets Rate of return on shareholders' equity 1.41 0.99 1.81 0.30 1.49 1 1.21 0.20 024 0.16 $16,497 $ 30,483 24,891 51,904 94,685 32,617 22,731 39,337 $ 27,878 $ 26,555 22,614 21,442 45,750 40,934 83,527 78,130 27,282 28,949 21.143 17,838 3 5,102 31,343 $ 24,356 19,793 35,969 70,349 25,803 18,712 25.834 $ 21,132 17,076 25,973 49,996 16,762 12,122 21,112 0.9 13 09 10.2% 21.6% 1.0 9.9% 20.1% 0.9 10.3% 22.0% 10.7% 22.9% 9.6% 22.4% Requirement 1. Analyze the company's financial summary for the fiscal years 2011-2015 to decide whether to invest in the common stock of WRS. Include the following sections in your analysis, and fully explain your final decision. a. Trend analysis for net sales and net income (use 2011 as the base year). b. Profitability analysis. c. Evaluate the ability to sell inventory (WRS uses the LIFO method). d. Evaluate the ability to pay debts. e. Evaluate the dividends. 2015 2014 2013 2012 2011 Total net revenues Trend Percentages 244.524 217909 191329165013 (139634 Net earnings Trend Percentages 8.39 6691 6295 5374 Comments: thand analysisiss! aline the net saleshevenue and n wely a coaptere meresd in Sched Requirement 2 2015 2014 T 2013 2012 2011 Net Income Net Sales Profit Margin Ratio 2 90 32 621 2722 32955.13122 2-29% 3.063-73% 3.26% 202% Comments: Thend analysis sharing that net sales and care las campang aheghaning continua ly Thirshaus acceptable situation for the investment in the company stack. Requirement 3 2015 2014 2013 Net Sales 1244 524 12 17 799/191329 1165013 Sales Cost of Goods Sold 191834 1171562 1150255 Gross Profit 152686 1 462309 41074 Bexi Gross Profit Percentage 21.55 21.23 2.44 1 2012 2011 574 129 164 > Beginning Inventory Ending Inventory Average Inventory 2261421442 1919 - 24 891 22.614 21442 23 752.5 | 22:28 | 20619.5 12993 18424.5 w VT865 Inventory Turnover 3.0717 7.788 1.2882 034 Days' sales in inventory 45.1916.86152.082 51.891 Comments: inventong turnover is cantinsa imaheseinad Lit shows company is able to sell ite inventary very easi I delite opal R = Requirement 4 This 0.53 353315 2015 2014 Total Assets Total Equity Total Liabilities 2013 T 2012 194685 183527 178130 90349 (19996 20319.40 11904.16 116032.28 21293.5410259.18 35033.45|3174.262 812 6.8 /29546.58 / 70g956 2011 34 Debt Ratio Debt to Equity Ratio 0.58 012 Net Income Income Tax Expense Interest Expense Total Times-interest- earned 3333 16295 y 89 1 3897 13692 lo73 11359 135.2. 211925 1310 1 11925 1737 12.188-19 3 22 113589 ratio 39 2 Current Ratio Quick Ratio 1.. 0.93 1-85 1.2 1.66 0.92 1.9 0.94 2.28 11:26 Comments: I Delut hatio is manethano. 58 in each yeart Shaw monothan hall al assets are acquired Shaw Requirement 5 2015 2014 2013 Annual Dividend per share Earnings per share Dimidend 29.992 2012 2011 0.30 Dividend payout 0.28 16.57 Comments: company has maintained steady boleto I diledend Hence it is good company to invest
Step by Step Solution
There are 3 Steps involved in it

Get step-by-step solutions from verified subject matter experts