

Question: Please solve this question in the yellow highlighted cells. Please it's very important to reference how the solution came about and show the working of
Please solve this question in the yellow highlighted cells. Please it's very important to reference how the solution came about and show the working of how each answer was gotten. The question starts from the bottom
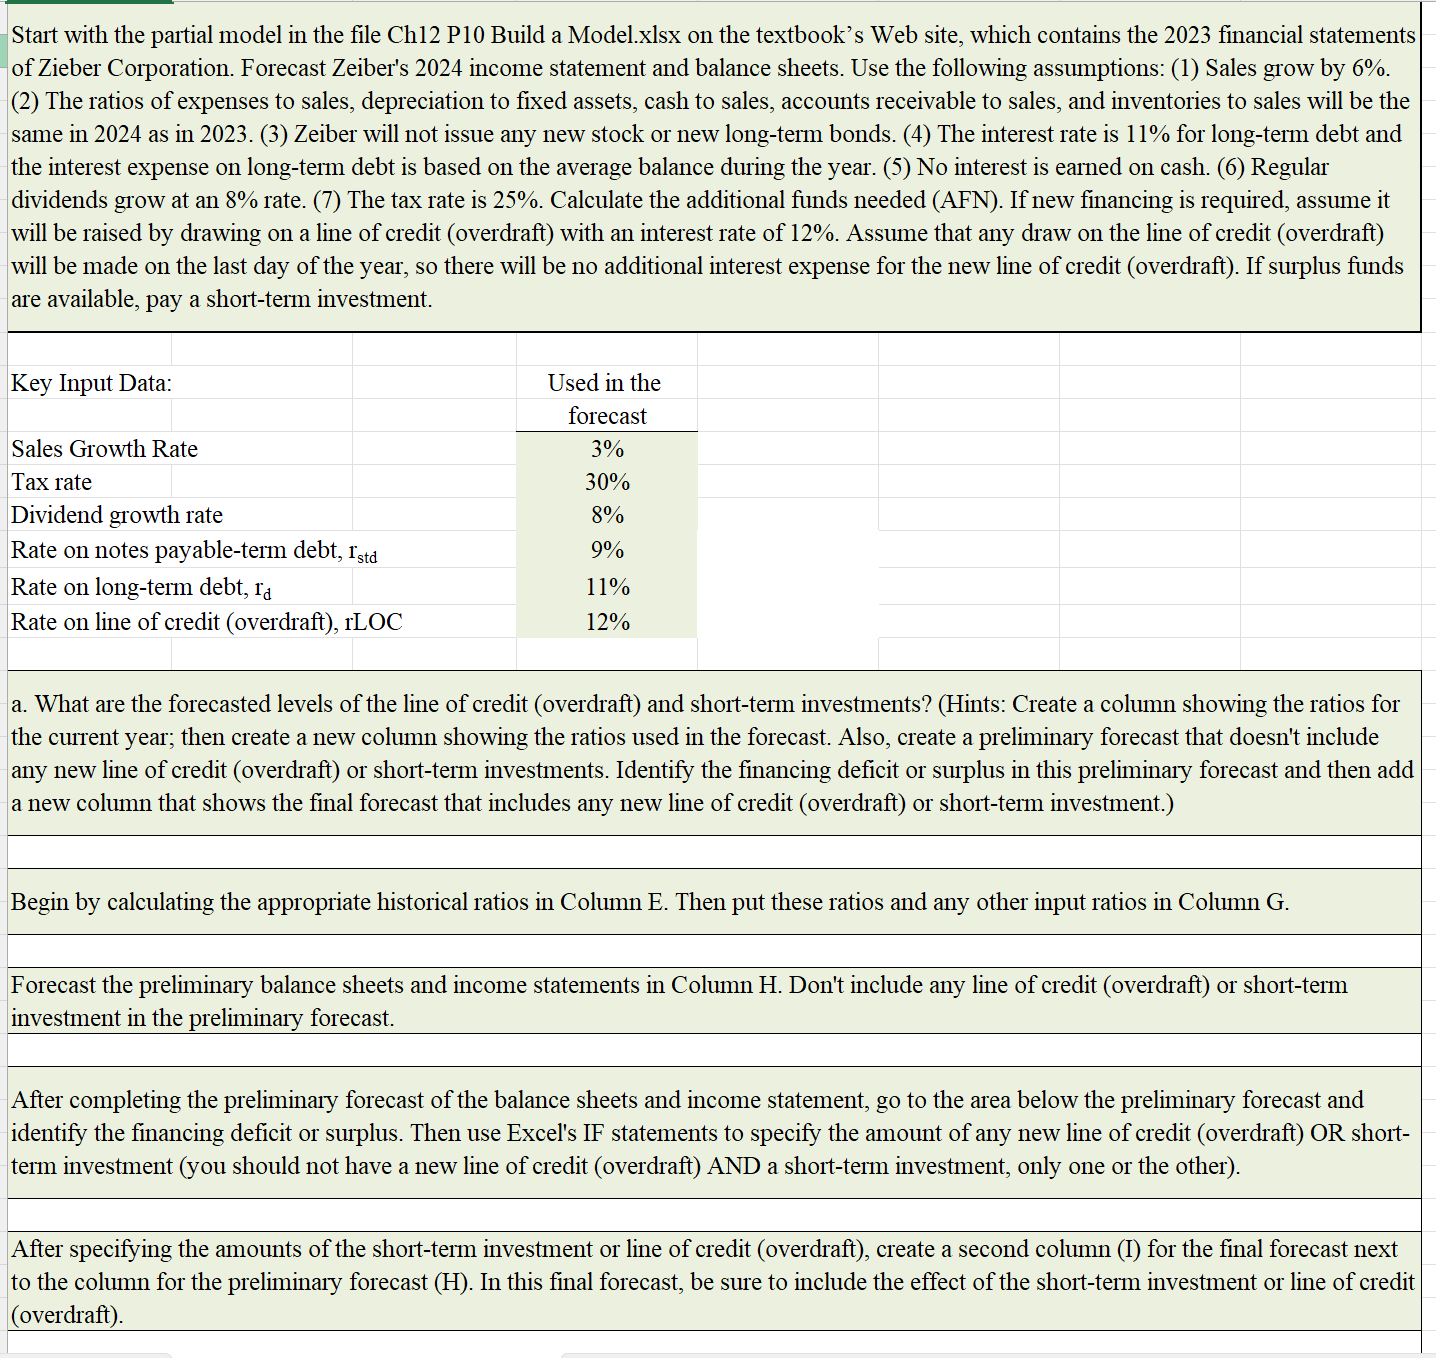
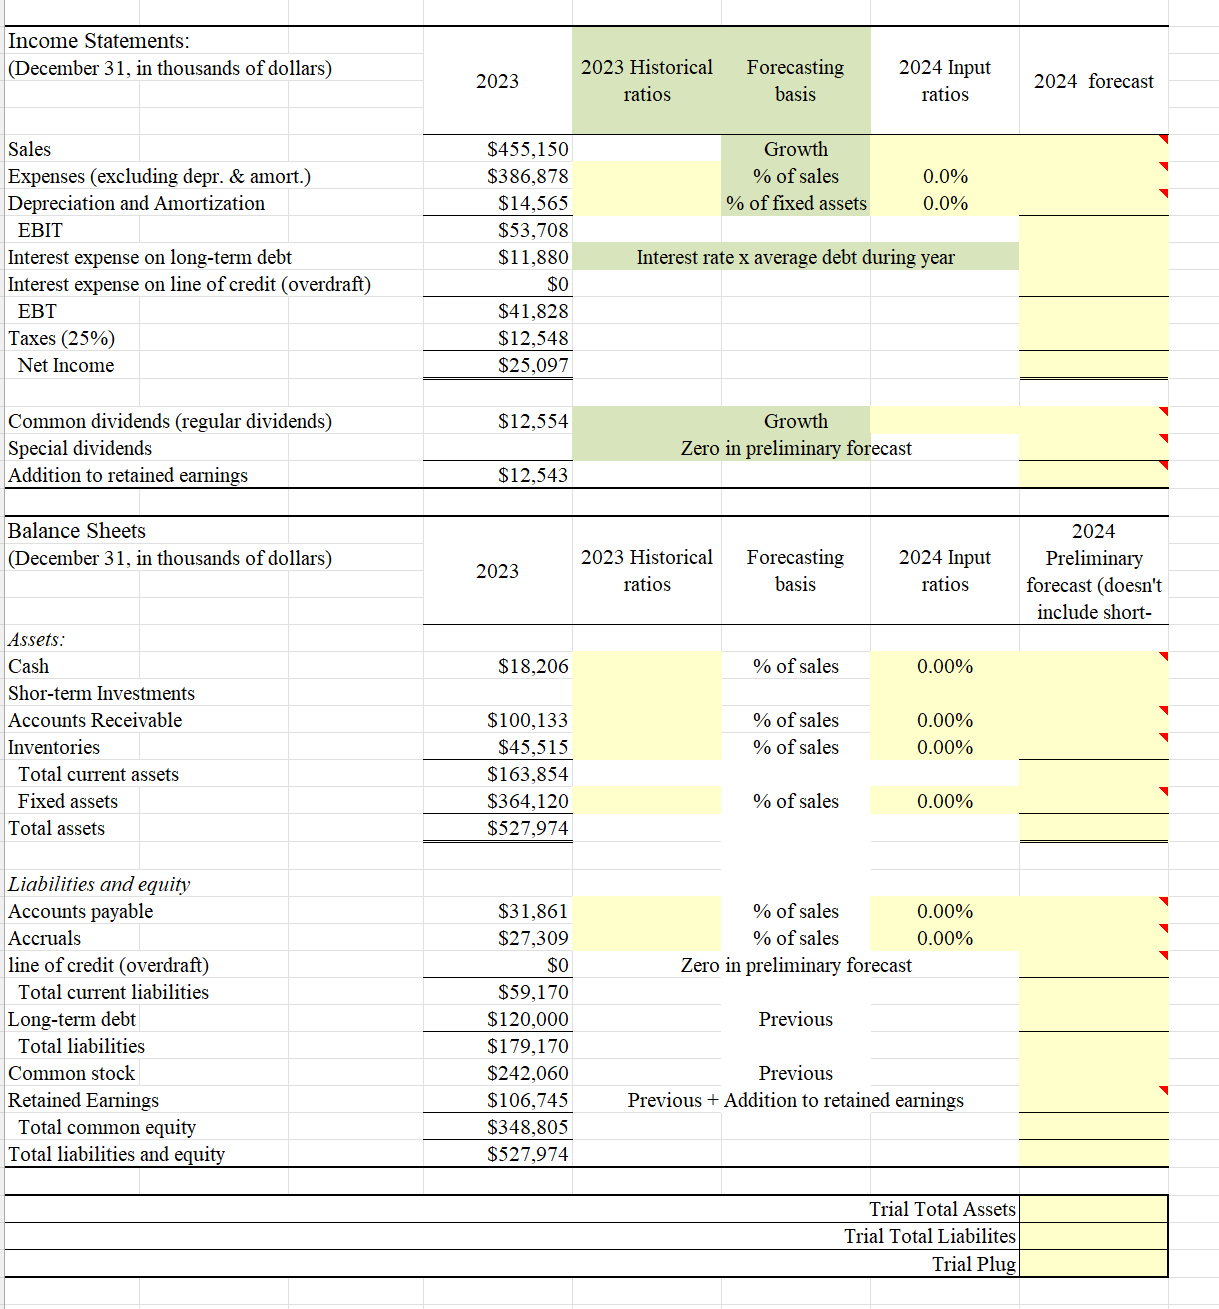
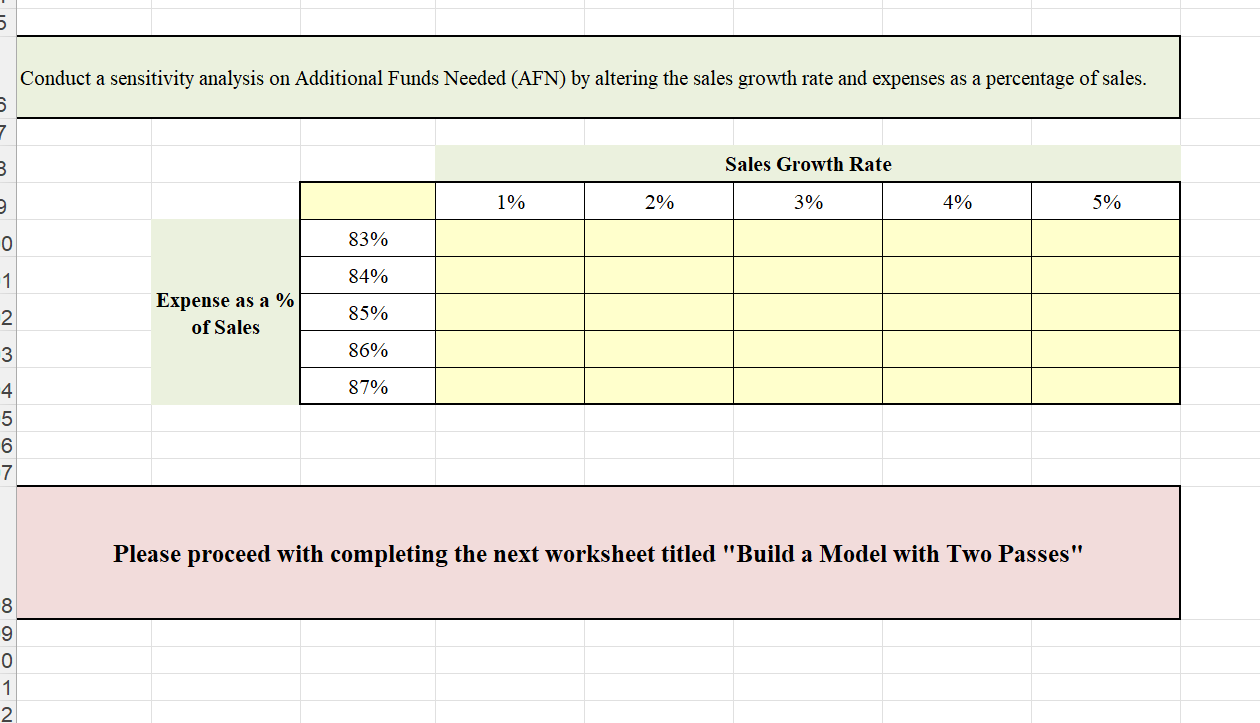
Start with the partial model in the file Ch12 P10 Build a Model.xIsx on the textbook's Web site, which contains the 2023 financial statements of Zieber Corporation. Forecast Zeiber's 2024 income statement and balance sheets. Use the following assumptions: (1) Sales grow by 6%. (2) The ratios of expenses to sales, depreciation to fixed assets, cash to sales, accounts receivable to sales, and inventories to sales will be the same in 2024 as in 2023. (3) Zeiber will not issue any new stock or new long-term bonds. (4) The interest rate is 11% for long-term debt and the interest expense on long-term debt is based on the average balance during the year. (5) No interest is earned on cash. (6) Regular dividends grow at an 8% rate. (7) The tax rate is 25%. Calculate the additional funds needed (AFN). If new financing is required, assume it will be raised by drawing on a line of credit (overdraft) with an interest rate of 12%. Assume that any draw on the line of credit (overdraft) will be made on the last day of the year, so there will be no additional interest expense for the new line of credit (overdraft). If surplus funds are available, pay a short-term investment. Key Input Data: Used in the forecast Sales Growth Rate 3% Tax rate 30% Dividend growth rate 8% Rate on notes payable-term debt, Istd 9% Rate on long-term debt, I'd 11% Rate on line of credit (overdraft), ILOC 12% a. What are the forecasted levels of the line of credit (overdraft) and short-term investments? (Hints: Create a column showing the ratios for the current year; then create a new column showing the ratios used in the forecast. Also, create a preliminary forecast that doesn't include any new line of credit (overdraft) or short-term investments. Identify the financing deficit or surplus in this preliminary forecast and then add a new column that shows the final forecast that includes any new line of credit (overdraft) or short-term investment.) Begin by calculating the appropriate historical ratios in Column E. Then put these ratios and any other input ratios in Column G. Forecast the preliminary balance sheets and income statements in Column H. Don't include any line of credit (overdraft) or short-term investment in the preliminary forecast After completing the preliminary forecast of the balance sheets and income statement, go to the area below the preliminary forecast and identify the financing deficit or surplus. Then use Excel's IF statements to specify the amount of any new line of credit (overdraft) OR short- term investment (you should not have a new line of credit (overdraft) AND a short-term investment, only one or the other). After specifying the amounts of the short-term investment or line of credit (overdraft), create a second column (1) for the final forecast next to the column for the preliminary forecast (H). In this final forecast, be sure to include the effect of the short-term investment or line of credit (overdraft)Income Statements: (December 31, in thousands of dollars) 2023 Historical Forecasting 2024 Input 2023 2024 forecast ratios basis ratios Sales $455,150 Growth Expenses (excluding depr. & amort.) $386,878 % of sales 0.0% Depreciation and Amortization $14,565 % of fixed assets 0.0% EBIT $53, 708 Interest expense on long-term debt $11,880 Interest rate x average debt during year Interest expense on line of credit (overdraft) $0 EBT $41,828 Taxes (25%) $12,548 Net Income $25,097 Common dividends (regular dividends) $12,554 Growth Special dividends Zero in preliminary forecast Addition to retained earnings $12,543 Balance Sheets 2024 (December 31, in thousands of dollars) 2023 Historical Forecasting 2024 Input Preliminary 2023 ratios basis ratios forecast (doesn't include short- Assets: Cash $18,206 % of sales 0.00% Shor-term Investments Accounts Receivable $100,133 % of sales 0.00% Inventories $45,515 % of sales 0.00% Total current assets $163,854 Fixed assets $364,120 % of sales 0.00% Total assets $527,974 Liabilities and equity Accounts payable $31,861 % of sales 0.00% Accruals $27,309 o of sales 0.00% line of credit (overdraft) $0 Zero in preliminary forecast Total current liabilities $59,170 Long-term debt $120,000 Previous Total liabilities $179,170 Common stock $242,060 Previous Retained Earnings $106,745 Previous + Addition to retained earnings Total common equity $348,805 Total liabilities and equity $527,974 Trial Total Assets Trial Total Liabilitys Trial PlugConduct a sensitivity analysis on Additional Funds Needed (AFN) by altering the sales growth rate and expenses as a percentage of sales. Sales Growth Rate 1% 2% 3% 4% 5% 83% O 84% Expense as a % 2 85% of Sales 86% 87% 6 Please proceed with completing the next worksheet titled "Build a Model with Two Passes" O
Step by Step Solution
There are 3 Steps involved in it

Get step-by-step solutions from verified subject matter experts