

Question: Please solve this questions 23 - 25. I think using excel will be good tho. Please upload at image or Excel file. 23. Construct a
Please solve this questions 23 - 25. I think using excel will be good tho. Please upload at image or Excel file.
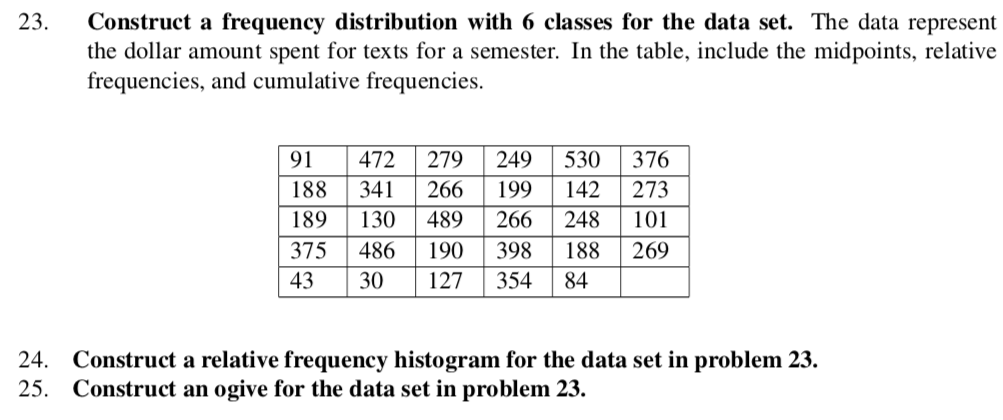
23. Construct a frequency distribution with 6 classes for the data set. The data represent the dollar amount spent for texts for a semester. In the table, include the midpoints, relative frequencies, and cumulative frequencies. 91 472 279 249 530 376 188 341 266 199 142 273 189 130 489 266 248 101 375 486 190 398 88 269 43 30 127 354 84 24. Construct a relative frequency histogram for the data set in problem 23. 25. Construct an ogive for the data set in problem 23
Step by Step Solution
There are 3 Steps involved in it
1 Expert Approved Answer
Step: 1 Unlock

Question Has Been Solved by an Expert!
Get step-by-step solutions from verified subject matter experts
Step: 2 Unlock
Step: 3 Unlock