

Question: Please solve this. Unit 6 Activity Sheet 1 Respond to all of the following questions (1-10) using the table to determine your answer. (Exhibit 1.1)
Please solve this.
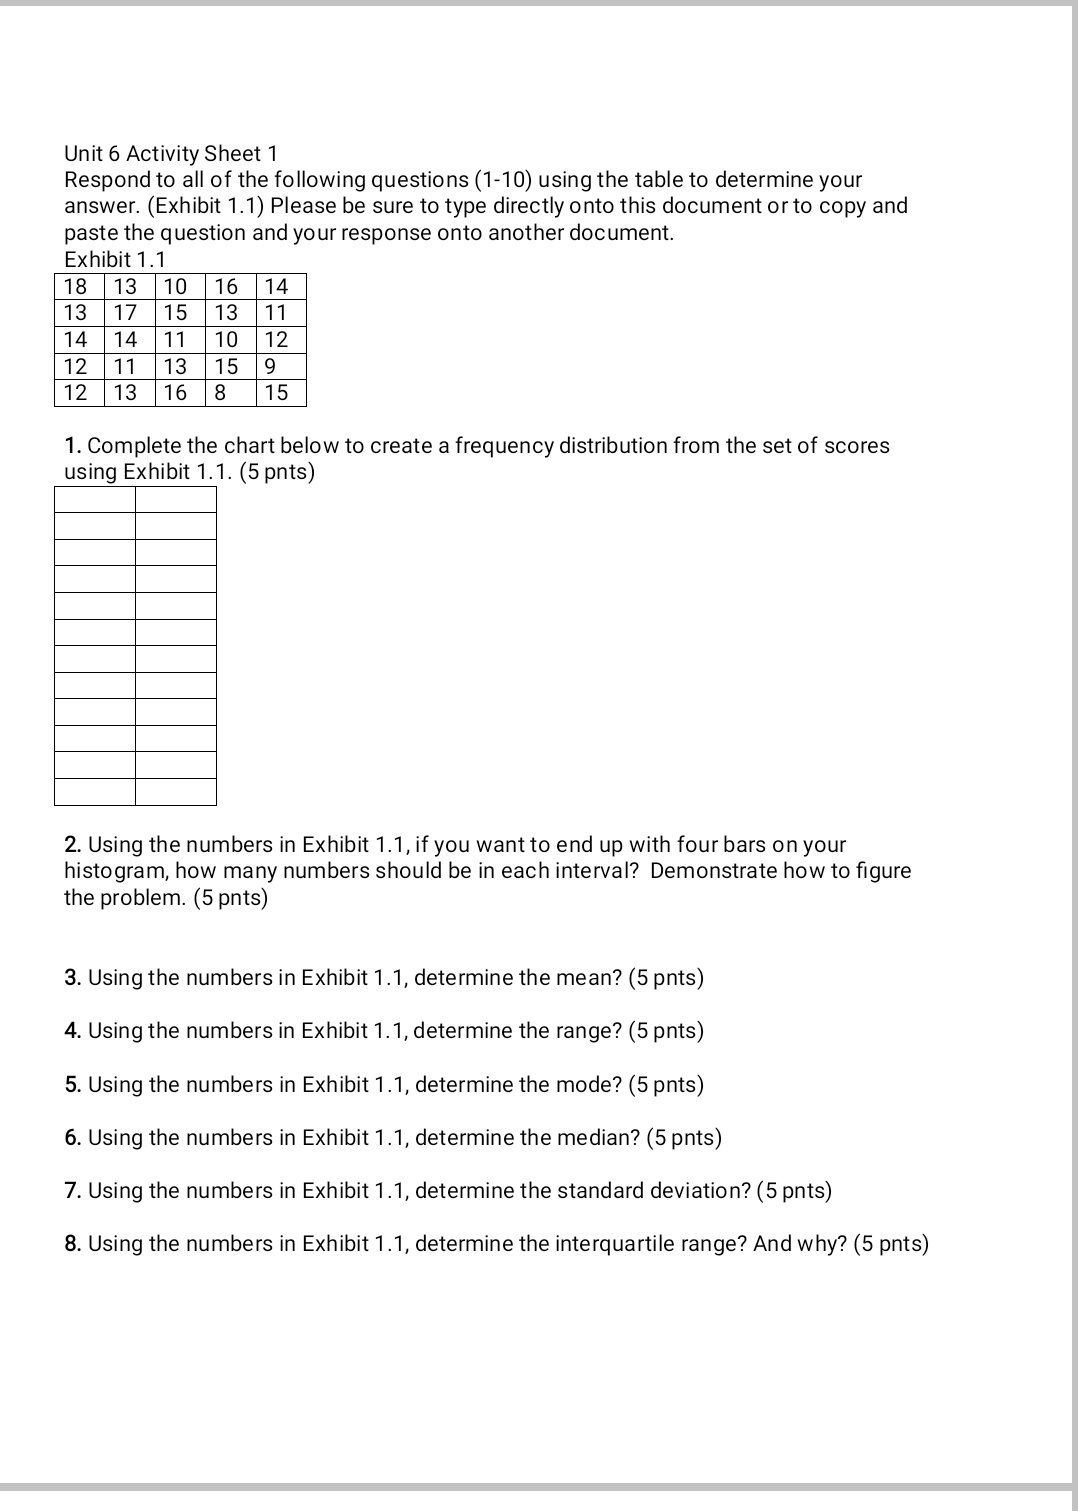
Unit 6 Activity Sheet 1 Respond to all of the following questions (1-10) using the table to determine your answer. (Exhibit 1.1) Please be sure to type directly onto this document or to copy and paste the question and your response onto another document. Exhibit 1.1 1. Complete the chart below to create a frequency distribution from the set of scores using Exhibit 1.1. (5 pnts) 2. Using the numbers in Exhibit 1.1, if you want to end up with four bars on your histogram, how many numbers should be in each interval? Demonstrate how to gure the problem. (5 pnts) 3. Using the numbers in Exhibit 1 .1, determine the mean? (5 pnts) 4. Using the numbers in Exhibit 1.1, determine the range? (5 pnts) 5. Using the numbers in Exhibit 1 .1, determine the mode? (5 pnts) 6. Using the numbers in Exhibit 1 .1, determine the median? (5 pnts) 7. Using the numbers in Exhibit 1 .1, determine the standard deviation? (5 pnts) 8. Using the numbers in Exhibit 1 .1, determine the interquartile range? And why? (5 pnts)
Step by Step Solution
There are 3 Steps involved in it

Get step-by-step solutions from verified subject matter experts