

Question: Please Solve this using MONTE CARLO SIMULATION PLEASE EXPLAIN THIS WITH STEPS IN EXCEL (USING @Risk) File Home Insert Page Layout Formulas Data Review View
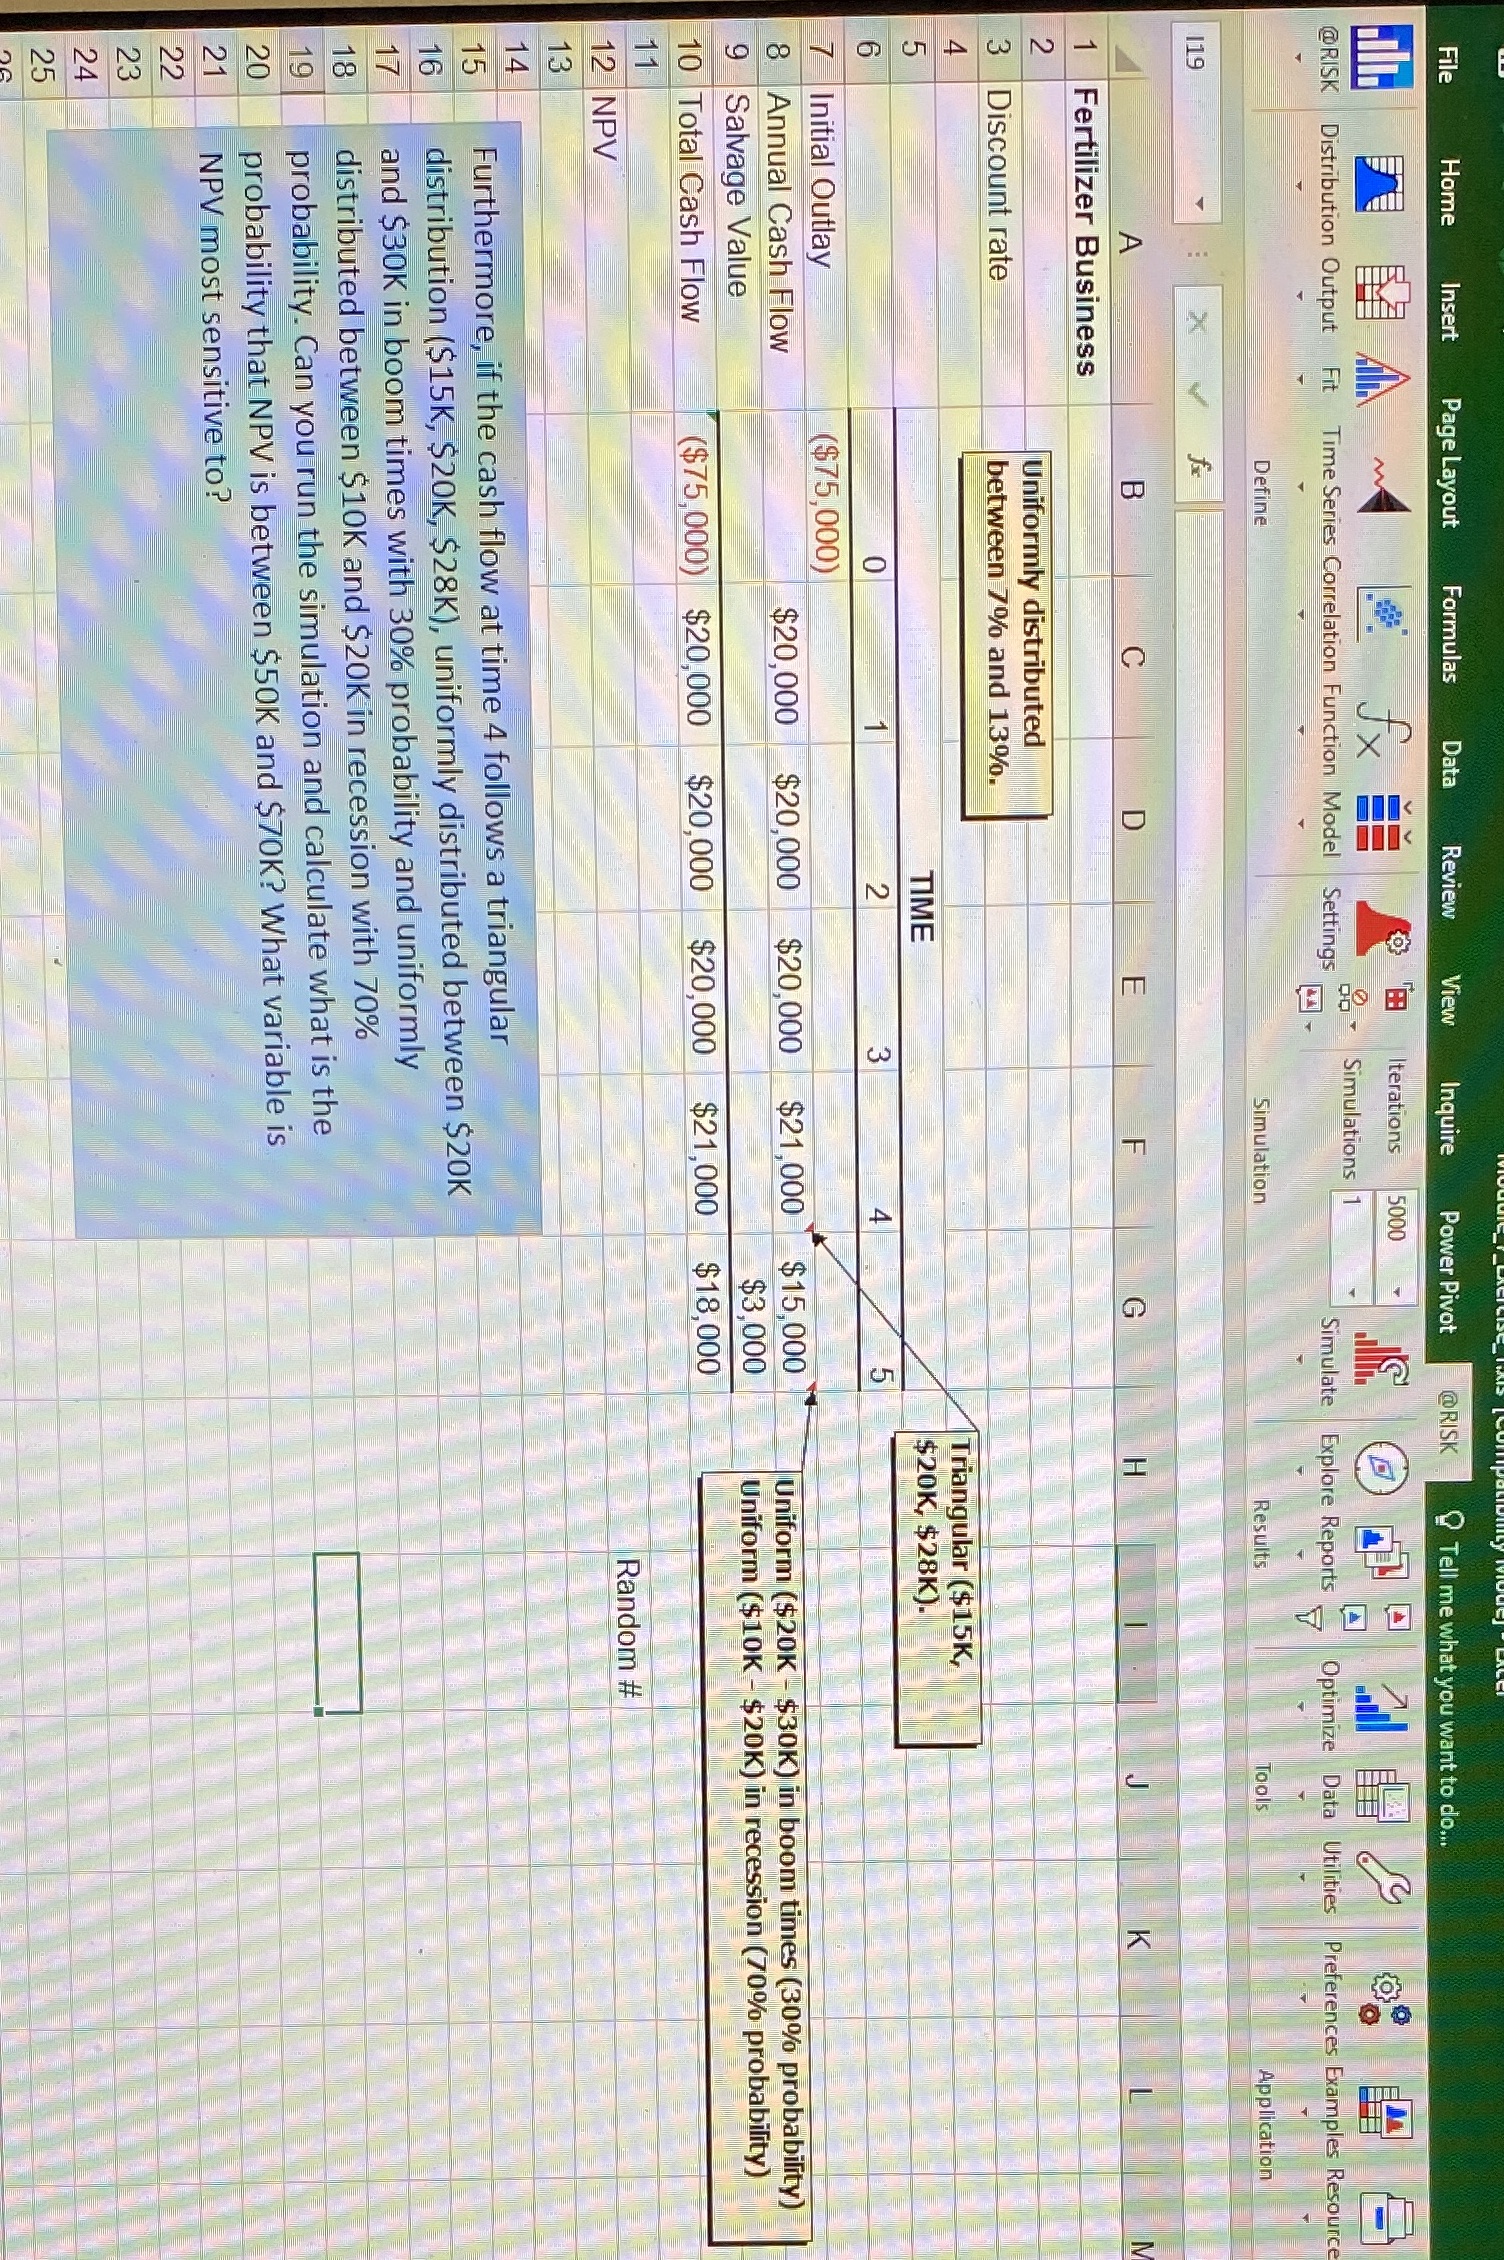
Please Solve this using MONTE CARLO SIMULATION PLEASE EXPLAIN THIS WITH STEPS IN EXCEL (USING @Risk)
Step by Step Solution
There are 3 Steps involved in it
1 Expert Approved Answer
Step: 1 Unlock

Question Has Been Solved by an Expert!
Get step-by-step solutions from verified subject matter experts
Step: 2 Unlock
Step: 3 Unlock