

Question: PLEASE SOLVE USING EXCEL AND SHOW FORMULA TEXT OR SHOW SOLVER PAGE Question 3: Monthly Mean Returns GM XOM AAPL 0.28% -0.32% 1.07% Monthly Variance-Covariance
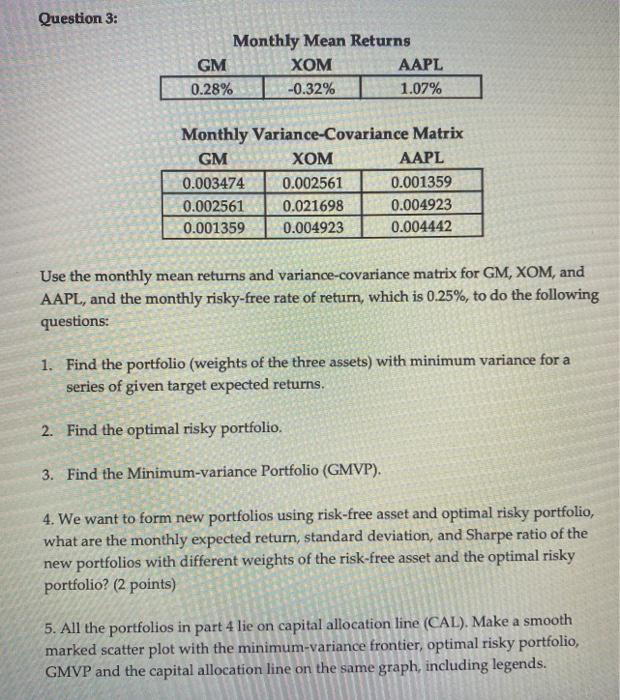
Question 3: Monthly Mean Returns GM XOM AAPL 0.28% -0.32% 1.07% Monthly Variance-Covariance Matrix GM XOM AAPL 0.003474 0.002561 0.001359 0.002561 0.021698 0.004923 0.001359 0.004923 0.004442 Use the monthly mean returns and variance-covariance matrix for GM, XOM, and AAPL, and the monthly risky-free rate of return, which is 0.25%, to do the following questions: 1. Find the portfolio (weights of the three assets) with minimum variance for a series of given target expected returns. 2. Find the optimal risky portfolio. 3. Find the Minimum-variance Portfolio (GMVP). 4. We want to form new portfolios using risk-free asset and optimal risky portfolio, what are the monthly expected return, standard deviation, and Sharpe ratio of the new portfolios with different weights of the risk-free asset and the optimal risky portfolio? (2 points) 5. All the portfolios in part 4 lie on capital allocation line (CAL). Make a smooth marked scatter plot with the minimum-variance frontier, optimal risky portfolio, GMVP and the capital allocation line on the same graph, including legends. Question 3: Monthly Mean Returns GM XOM AAPL 0.28% -0.32% 1.07% Monthly Variance-Covariance Matrix GM XOM AAPL 0.003474 0.002561 0.001359 0.002561 0.021698 0.004923 0.001359 0.004923 0.004442 Use the monthly mean returns and variance-covariance matrix for GM, XOM, and AAPL, and the monthly risky-free rate of return, which is 0.25%, to do the following questions: 1. Find the portfolio (weights of the three assets) with minimum variance for a series of given target expected returns. 2. Find the optimal risky portfolio. 3. Find the Minimum-variance Portfolio (GMVP). 4. We want to form new portfolios using risk-free asset and optimal risky portfolio, what are the monthly expected return, standard deviation, and Sharpe ratio of the new portfolios with different weights of the risk-free asset and the optimal risky portfolio? (2 points) 5. All the portfolios in part 4 lie on capital allocation line (CAL). Make a smooth marked scatter plot with the minimum-variance frontier, optimal risky portfolio, GMVP and the capital allocation line on the same graph, including legends
Step by Step Solution
There are 3 Steps involved in it

Get step-by-step solutions from verified subject matter experts