

Question: Please solve using Excel and solve as a set-covering problem. A telecom company needs to build a set of cell towers to provide signal coverage
Please solve using Excel and solve as a set-covering problem.
A telecom company needs to build a set of cell towers to provide signal coverage for the inhabitants of a given city. A number of potential locations where the towers could be built have been identified. The towers have a fixed range, and due to budget constraints only a limited number of them can be built. Given these restrictions, the company wishes to provide coverage to the largest percentage of the population possible. To simplify the problem, the company has split the area it wishes to cover into a set of regions, each of which has a known population. The goal is then to choose which of the potential regions the company should build cell towers on in order to provide coverage to as many people as possible.
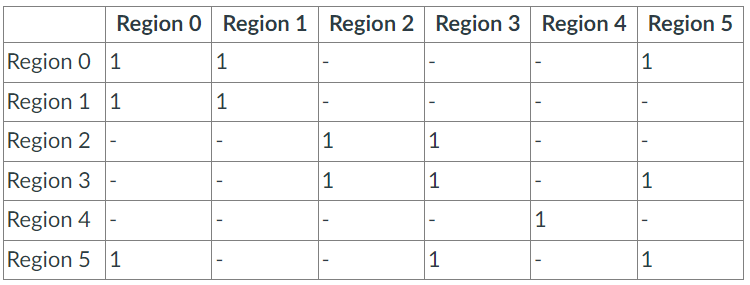
The table below shows which of the regions are covered when a tower is build in that region. Note "-" means the tower build cannot serve the region.
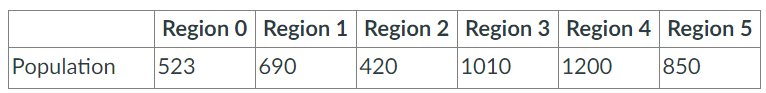
The population at each region is stated in the following table.
The cost to build a cell tower at each location site is stated in the following table.
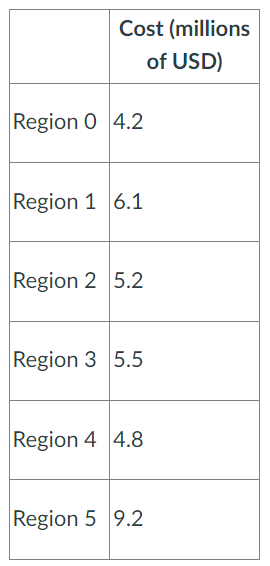
The allocated budget is $20,000,000
\begin{tabular}{|l|l|l|l|l|l|l|} \hline & Region 0 & Region 1 & Region 2 & Region 3 & Region 4 & Region 5 \\ \hline Region 0 & 1 & 1 & & & & 1 \\ \hline Region 1 & 1 & 1 & & & & \\ \hline Region 2 & & & 1 & 1 & & \\ \hline Region 3 & & & 1 & 1 & & 1 \\ \hline Region 4 & & & & & 1 & \\ \hline Region 5 & 1 & & & 1 & & 1 \\ \hline \end{tabular} \begin{tabular}{|l|l|l|l|l|l|l|} \hline & Region 0 & Region 1 & Region 2 & Region 3 & Region 4 & Region 5 \\ \hline Population & 523 & 690 & 420 & 1010 & 1200 & 850 \\ \hline \end{tabular} \begin{tabular}{|l|l|} \hline & Cost(millionsofUSD) \\ \hline Region 0 & 4.2 \\ \hline Region 1 & 6.1 \\ \hline Region 2 & 5.2 \\ \hline Region 3 & 5.5 \\ \hline Region 4 & 4.8 \\ \hline Region 5 & 9.2 \\ \hline \end{tabular} \begin{tabular}{|l|l|l|l|l|l|l|} \hline & Region 0 & Region 1 & Region 2 & Region 3 & Region 4 & Region 5 \\ \hline Region 0 & 1 & 1 & & & & 1 \\ \hline Region 1 & 1 & 1 & & & & \\ \hline Region 2 & & & 1 & 1 & & \\ \hline Region 3 & & & 1 & 1 & & 1 \\ \hline Region 4 & & & & & 1 & \\ \hline Region 5 & 1 & & & 1 & & 1 \\ \hline \end{tabular} \begin{tabular}{|l|l|l|l|l|l|l|} \hline & Region 0 & Region 1 & Region 2 & Region 3 & Region 4 & Region 5 \\ \hline Population & 523 & 690 & 420 & 1010 & 1200 & 850 \\ \hline \end{tabular} \begin{tabular}{|l|l|} \hline & Cost(millionsofUSD) \\ \hline Region 0 & 4.2 \\ \hline Region 1 & 6.1 \\ \hline Region 2 & 5.2 \\ \hline Region 3 & 5.5 \\ \hline Region 4 & 4.8 \\ \hline Region 5 & 9.2 \\ \hline \end{tabular}
Step by Step Solution
There are 3 Steps involved in it

Get step-by-step solutions from verified subject matter experts