

Question: PLEASE SOLVE USING PYTHON Consider the following Gross Domestic Product (GDP) data for the US in trillions of UD dollars (real US GDP, i.e., not
 PLEASE SOLVE USING PYTHON
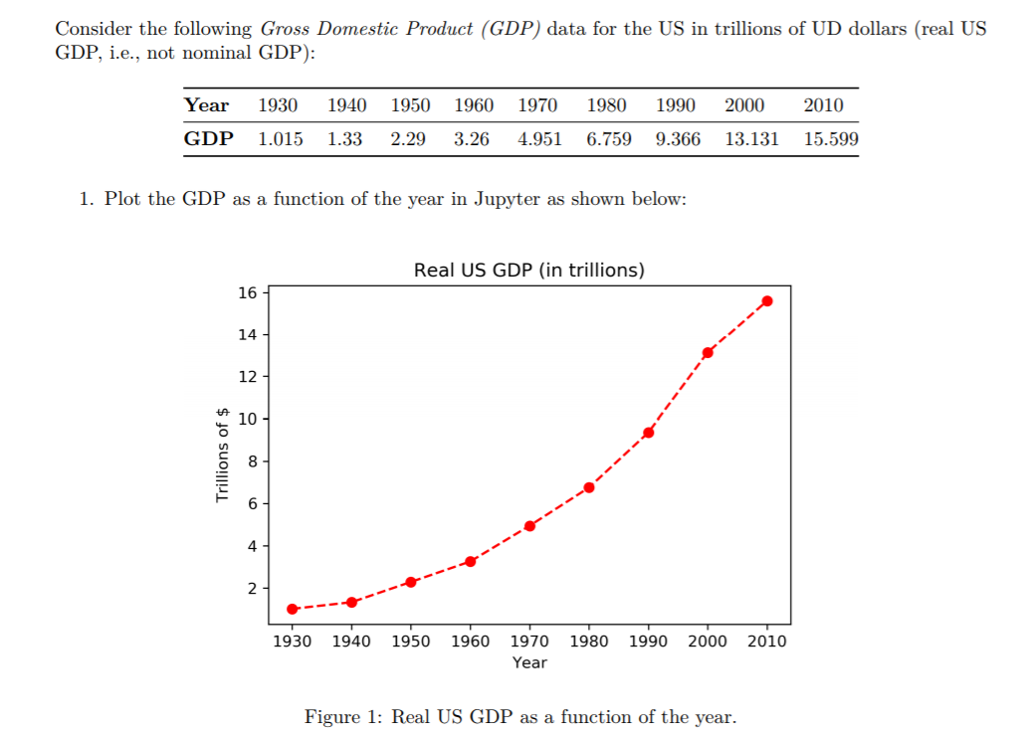
Consider the following Gross Domestic Product (GDP) data for the US in trillions of UD dollars (real US GDP, i.e., not nominal GDP): Year 1930 1940 1950 1960 1970 1980 1990 2000 2010 GDP 1.015 1.33 2.29 3.26 4.951 6.759 9.366 13.131 15.599 1. Plot the GDP as a function of the year in Jupyter as shown below: Real US GDP (in trillions) 16 - 14 12 10 8 6 4 1930 1940 1950 1960 1970 1980 1990 2000 2010 Year Figure 1: Real US GDP as a function of the year
Step by Step Solution
There are 3 Steps involved in it
1 Expert Approved Answer
Step: 1 Unlock

Question Has Been Solved by an Expert!
Get step-by-step solutions from verified subject matter experts
Step: 2 Unlock
Step: 3 Unlock