

Question: Solve using Python spyder. The airline_delay on the right is just a snapshot of the file. explain in steps. Origin Airport: LGA STEP 1 Flights
Solve using Python spyder. The airline_delay on the right is just a snapshot of the file. explain in steps.
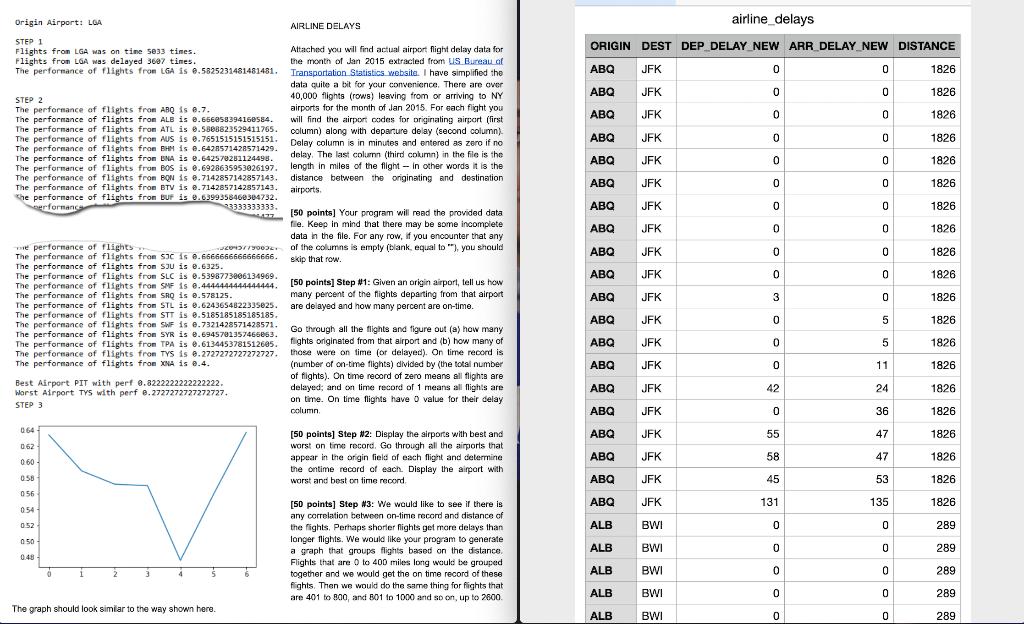
Origin Airport: LGA STEP 1 Flights from LGA was on time 5033 times. Flights from LGA was delayed 3607 times. The performance of flights from LGA is 0.5825231481481481. STEP 2 The performance of flights from ABQ is 0.7. The performance of flights from ALB is 0.656058394160584. The performance of flights from ATL is 0.5808823529411765. The performance of flights from AUS is 0.7651515151515151. The performance of flights from BHM is 0.6428571428571429. The performance of flights from BNA is 0.642578281124498. The performance of flights from BOS is 0.6928635953026197. The performance of flights from BQN is 0.7142857142857143. The performance of flights from BTV is 0.7142857142857143. the performance of flights from BUF is 0.6399358460364732. performance 3333333333. e performance of flights The performance of flights from $3C is The performance of flights from SJU is 0.6325. The performance of flights from SLC is 0.5398773006134969. The performance of flights from SMF is 0.4444444444444444. The performance of flights from SRQ is 0.578125. The performance of flights from STL is 0.6243654822335025. The performance of flights from STT is 0.5185185185185185. The performance of flights from SWF is 0.7321428571428571. The performance of flights from SYR is 0.6945701357466863. The performance of flights from TPA is 0.6134453781512605. The performance of flights from TYS is 0.2727272727272727. The performance of flights from XNA is 8.4. Best Airport PIT with perf 0.8222222222222222. Worst Airport TYS with perf 8.2727272727272727. STEP 3 064 0.62 0.60 0.58 att 056 ATL 0.54 0.52 0:50 0.48- 3 220437/90032 0.6666666666666666. 4 The graph should look similar to the way shown here. AIRLINE DELAYS Attached you will find actual airport flight delay data for the month of Jan 2015 extracted from US Bureau of Transportation Statistics website. I have simplified the data quite a bit for your convenience. There are over 40,000 flights (rows) leaving from or arriving to NY airports for the month of Jan 2015. For each flight you will find the airport codes for originating airport (first column) along with departure delay (second column) Delay column is in minutes and entered as zero if no delay. The last column (third column) in the file is the length in miles of the flight in other words it is the distance between the originating and destination airports. [50 points] Your program will read the provided data file. Keep in mind that there may be some incomplete data in the file. For any row, if you encounter that any of the columns is empty (blank, equal to "), you should skip that row. [50 points] Step #1: Given an origin airport, tell us how many percent of the flights departing from that airport are delayed and how many percent are on-time. Go through all the flights and figure out (a) how many flights originated from that airport and (b) how many of those were on time (or delayed). On time record is (number of on-time flights) divided by (the total number of flights). On time record of zero means all flights are delayed; and on time record of 1 means all flights are on time. On time flights have 0 value for their delay column. [50 points] Step #2: Display the airports with best and worst on time record. Go through all the airports that appear in the origin field of each flight and determine the ontime record of each. Display the airport with worst and best on time record. [50 points] Step #3: We would like to see if there is any correlation between on-time record and distance of the fights. Perhaps shorter flights get more delays than longer flights. We would like your program to generate a graph that groups flights based on the distance. Flights that are 0 to 400 miles long would be grouped together and we would get the on time record of these fights. Then we would do the same thing for flights that are 401 to 800, and 801 to 1000 and so on, up to 2600. airline_delays ORIGIN DEST DEP_DELAY NEW ARR_DELAY NEW DISTANCE ABQ JFK ABQ JFK ABQ JFK ABQ JFK ABQ JFK ABQ JFK ABQ JFK ABQ JFK ABQ JFK ABQ JFK ABQ JFK ABQ JFK ABQ JFK ABQ JFK ABQ JFK ABQ JFK ABQ JFK ABQ JFK ABQ JFK ABQ JFK ALB BWI ALB BWI ALB BWI ALB BWI ALB BWI 0 0 0 0 0 0 0 0 0 0 3 0 0 0 42 0 55 58 45 131 0 0 0 0 0 0 0 0 0 0 0 0 0 0 0 0 5 5 11 24 36 47 47 53 135 0 0 0 0 0 1826 1826 1826 1826 1826 1826 1826 1826 1826 1826 1826 1826 1826 1826 1826 1826 1826 1826 1826 1826 289 289 289 289 289
Step by Step Solution
3.48 Rating (171 Votes )
There are 3 Steps involved in it
Read the CSV files containing the airline delay data into a single DataFrame Then display the total number of rows imported Change the date column to date format YYYYM eg 20181 Then perform explorator... View full answer

Get step-by-step solutions from verified subject matter experts