

Question: Please solve using R, include all code Problem 2. Data in the table below come from a series of tests to determine how temperature {C}
Please solve using R, include all code
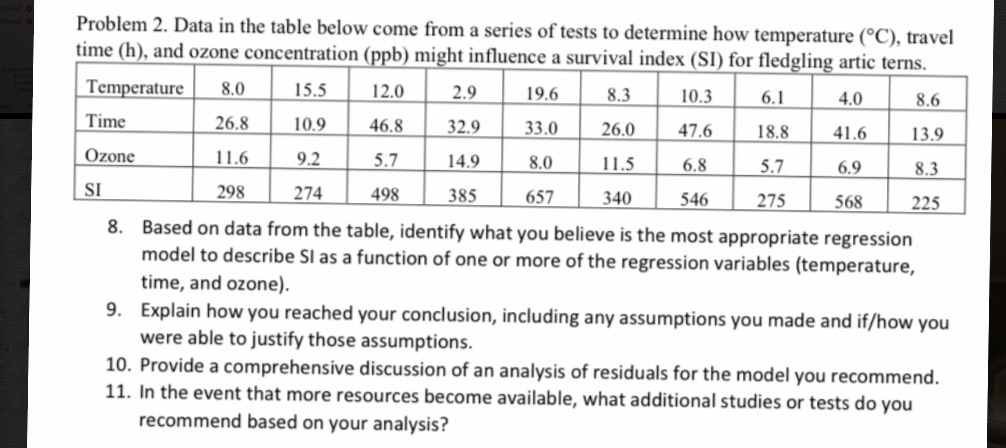
Problem 2. Data in the table below come from a series of tests to determine how temperature {\"C} travel time (h), and ozone concentration ( y b) mi_ ' ' - ' . ' \"ME\" 8. Based on data from the table, identify what you believe is the most appropriate regression model to describe SI as a function of one or more of the regression variables (temperature. time, and ozone}. 9. Explain how you reached your conclusion, including any assumptions you made and iflhow you were able to justify those assumptions. 10. Provide a comprehensive discussion of an analysis of residuals for the model you recommend. 11. in the event that more resources become available, what additional studies or tests do you recommend based on your analysis
Step by Step Solution
There are 3 Steps involved in it

Get step-by-step solutions from verified subject matter experts