

Question: please solve with excel and please show the solution on excel PRODUCT ANALYSIS Before generating a dashboard in PowerBI, you want to make an analysis
please solve with excel and please show the solution on excel
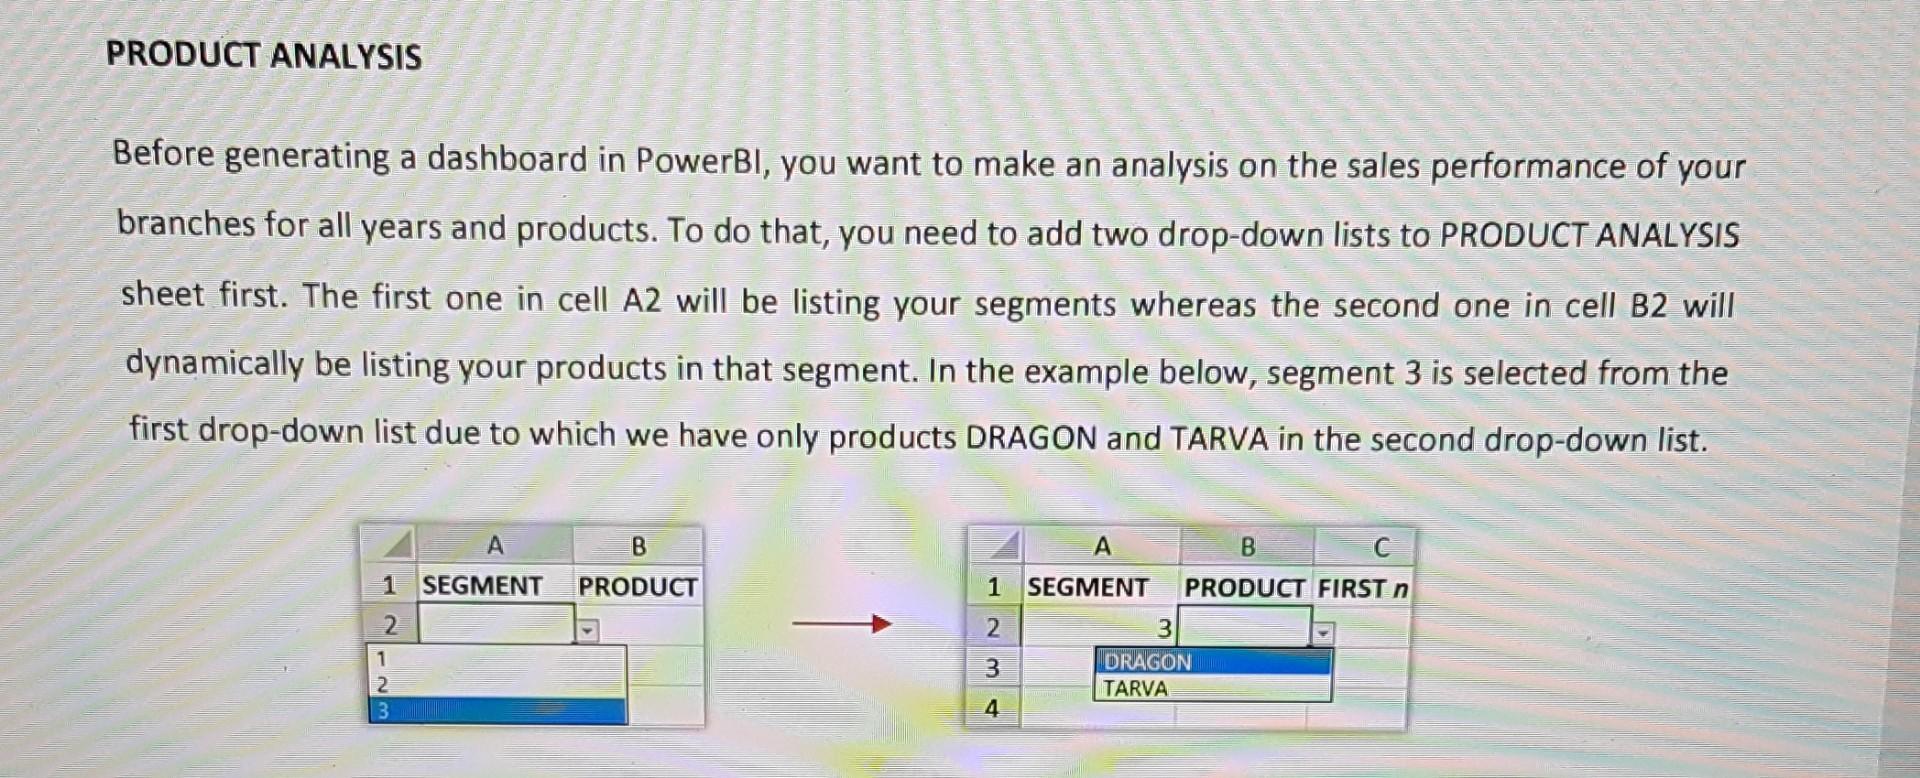
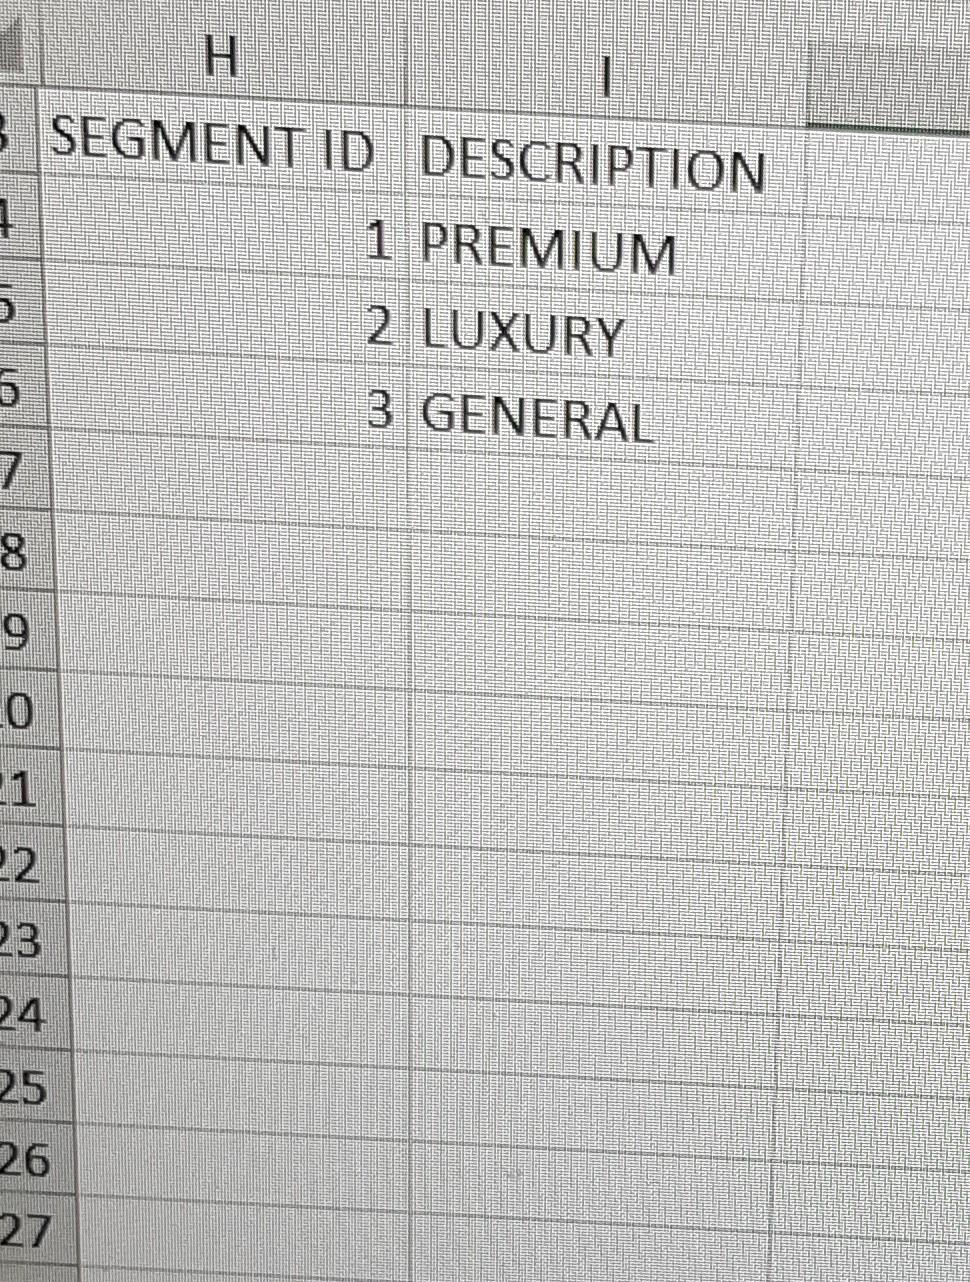
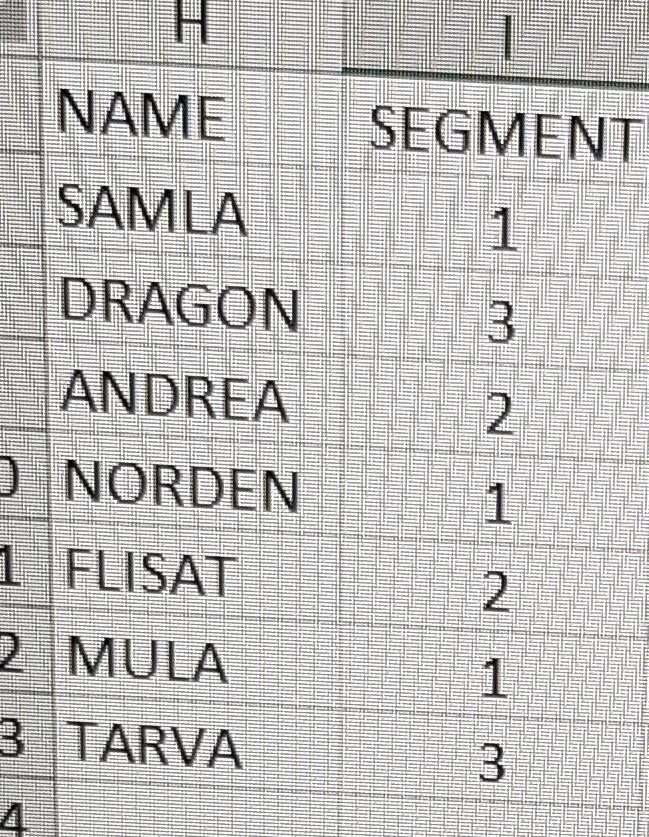
PRODUCT ANALYSIS Before generating a dashboard in PowerBI, you want to make an analysis on the sales performance of your branches for all years and products. To do that, you need to add two drop-down lists to PRODUCT ANALYSIS sheet first. The first one in cell A2 will be listing your segments whereas the second one in cell B2 will dynamically be listing your products in that segment. In the example below, segment 3 is selected from the first drop-down list due to which we have only products DRAGON and TARVA in the second drop-down list. A B A B 1 SEGMENT PRODUCT 1 SEGMENT PRODUCT FIRST n 22 2 3 1 2 3 3 DRAGON TARVA 4 5 SEGMENT ID DESCRIPTION 3 1 1 PREMIUM 5 2. LUXURY 3 GENERAL 7 8 9 0 1 22 23 24 225 26 27 H NAME SEGMENT SAMLA 1 DRAGON 3 ANDREA 2 ) NORDEN 1 1 FLISAT 2 2 MULA 1 3 TARVA 3 3 4
Step by Step Solution
There are 3 Steps involved in it

Get step-by-step solutions from verified subject matter experts