

Question: Please solve with full explanations and clear format. Thanks I. A sample of 36 out of 25,000 baseball fans attending a game revealed average refreshment
Please solve with full explanations and clear format. Thanks
I. A sample of 36 out of 25,000 baseball fans attending a game revealed average refreshment spending of $7.60. The population standard deviation was $2.10. The makers of Dud beer will not distribute their product to a ballpark unless it is possible that the average fan spends at least $8.00 on refreshments. Use the 5-step approach to hypothesis testing and a 01 level of significance to test whether this ballpark qualifies to receive Dud beer.
II. A marketing test of chocolate flavored shaving cream revealed a favorable response from 35 of 50 test subjects. Test subjects were chosen at random from the company's 1,200 employees. This product will be manufactured if at least 80% of the potential market like the product.
A. Using the 5-step approach to hypothesis testing and a .05 level of significance, determine whether the product will be manufactured.
B. What are the pros and cons of using company employees to test this product?
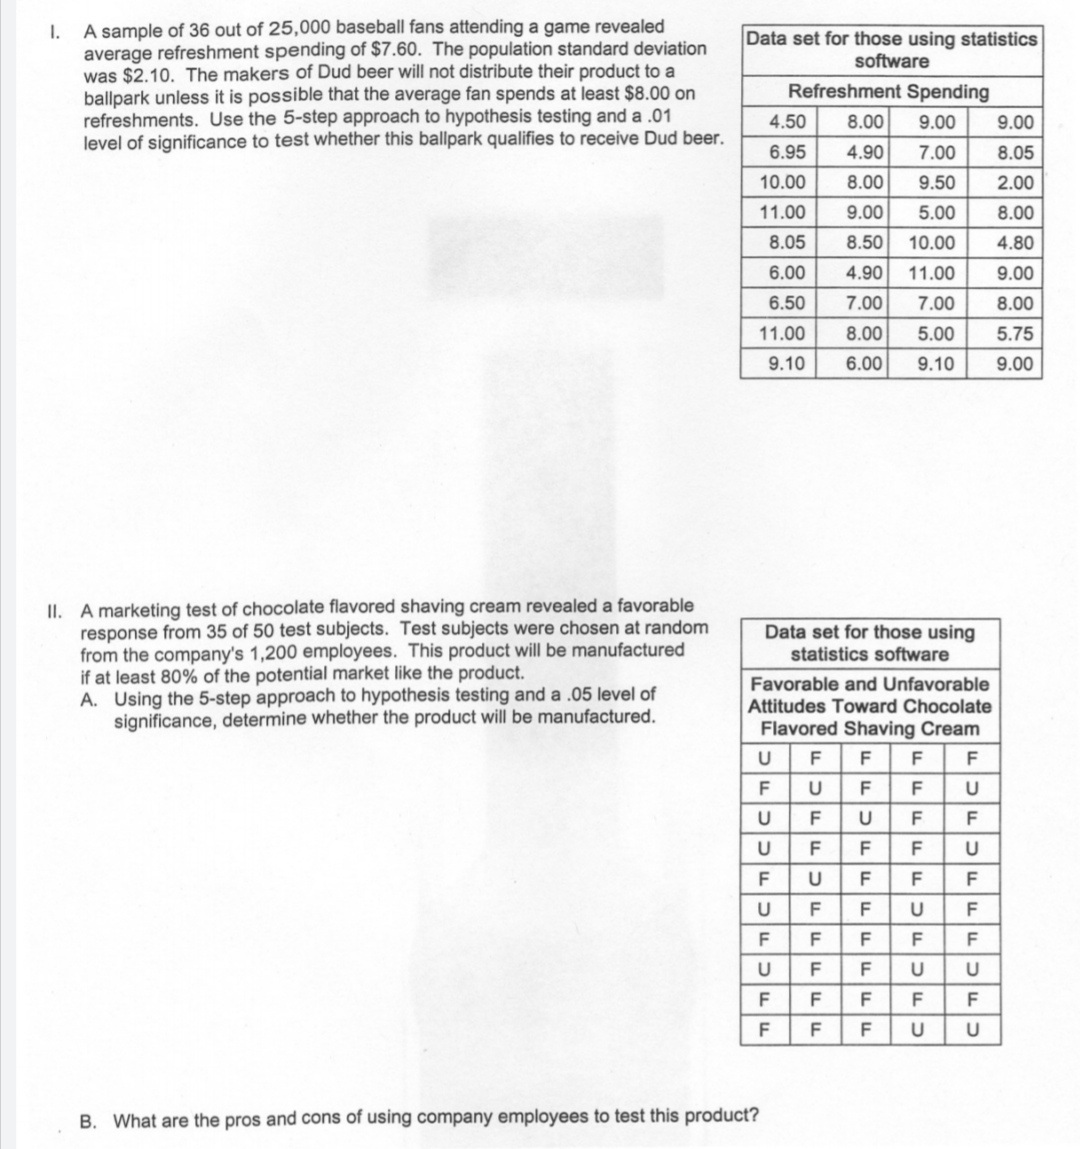
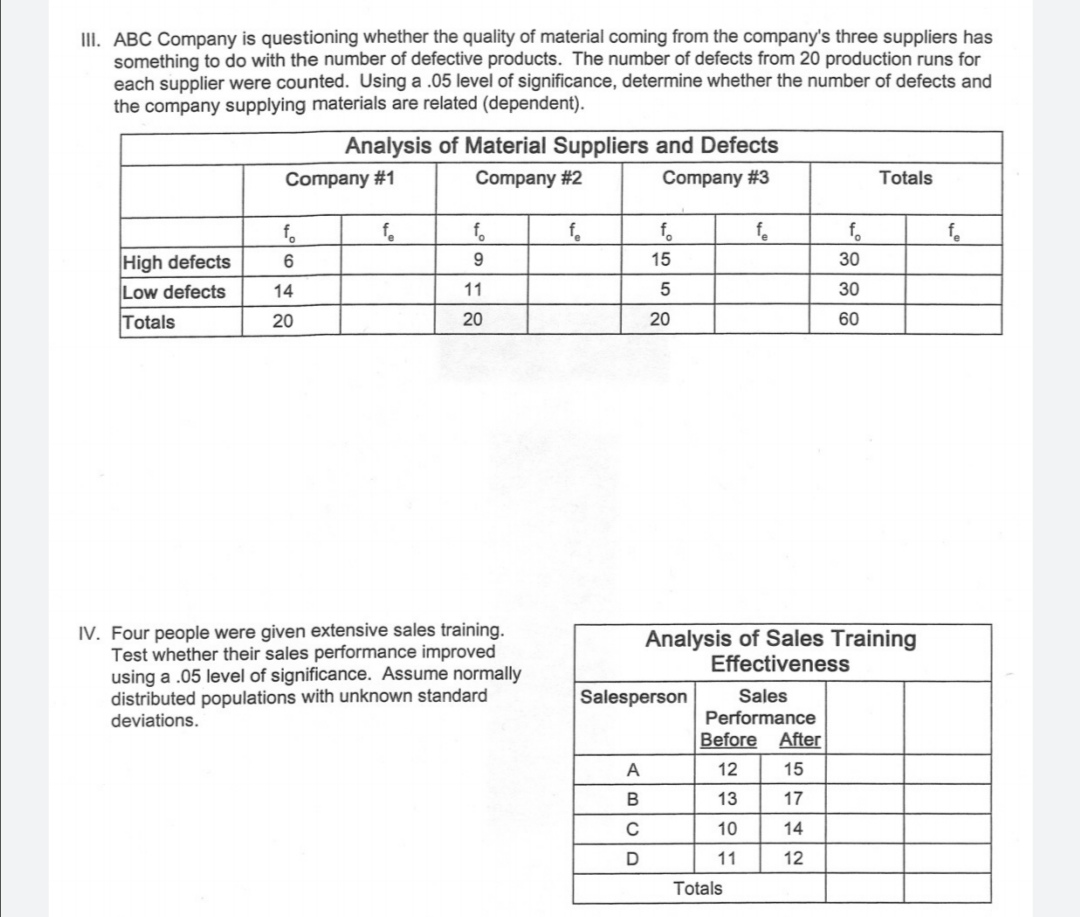
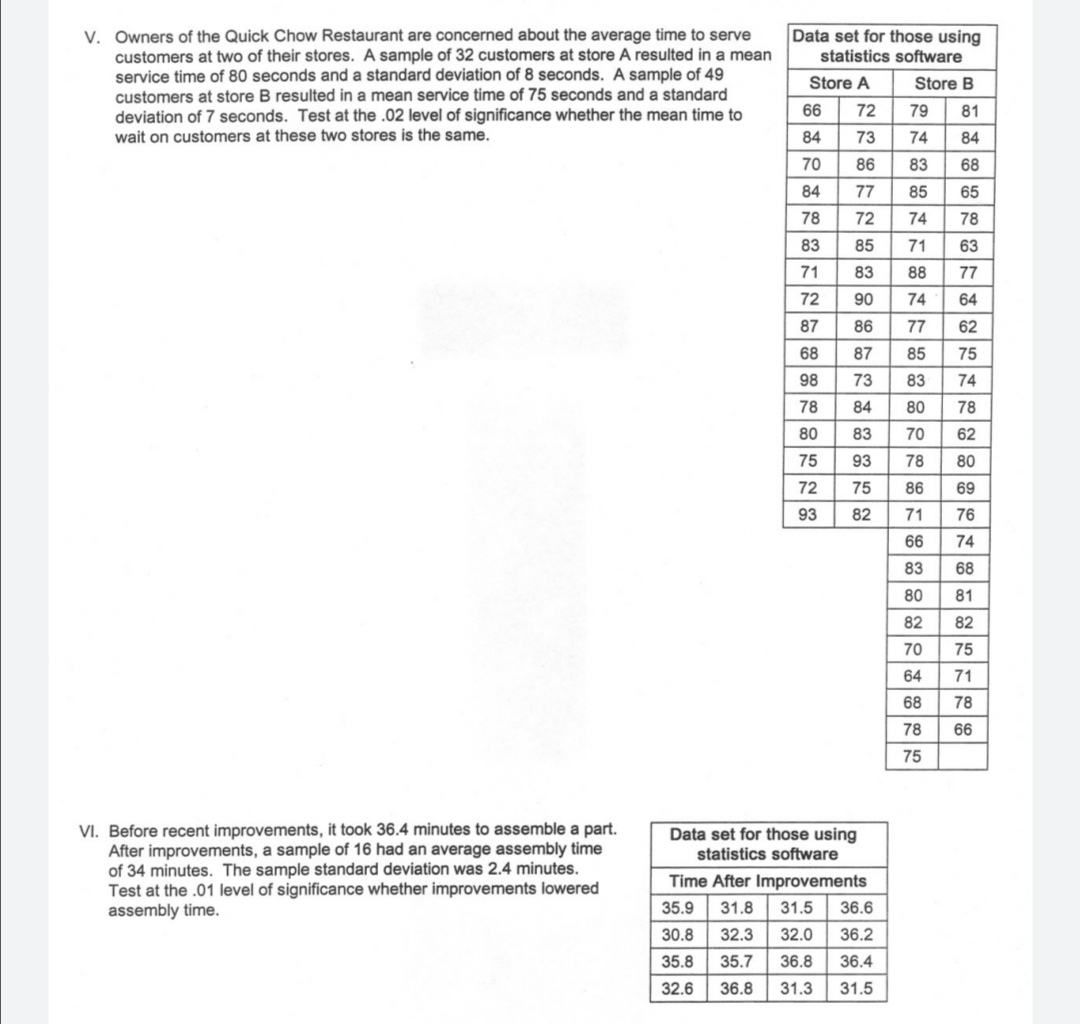
1. A sample of 36 out of 25,000 baseball fans attending a game revealed average refreshment spending of $7.60. The population standard deviation Data set for those using statistics was $2.10. The makers of Dud beer will not distribute their product to a software ballpark unless it is possible that the average fan spends at least $8.00 on Refreshment Spending refreshments. Use the 5-step approach to hypothesis testing and a .01 4.50 8.00 9.00 level of significance to test whether this ballpark qualifies to receive Dud beer. 9.00 6.95 1.90 7.00 8.05 10.00 3.00 9.50 2.00 11.00 9.0 5.00 8.00 8.05 8.50 10.00 4.80 6.00 4.90 11.00 9.00 6.50 7.00 7.00 8.00 11.00 8.00 5.00 5.75 9.10 6.00 9.10 9.00 II. A marketing test of chocolate flavored shaving cream revealed a favorable response from 35 of 50 test subjects. Test subjects were chosen at random Data set for those using from the company's 1,200 employees. This product will be manufactured statistics software if at least 80% of the potential market like the product. A. Using the 5-step approach to hypothesis testing and a .05 level of Favorable and Unfavorable significance, determine whether the product will be manufactured. Attitudes Toward Chocolate Flavored Shaving Cream U F F F F F U F F U U F U F F U F F F U F U F F F U F F U F F F F F F U F F U U F F F F F F F U U B. What are the pros and cons of using company employees to test this product?Ill. ABC Company is questioning whether the quality of material coming from the company's three suppliers has something to do with the number of defective products. The number of defects from 20 production runs for each supplier were counted. Using a .05 level of significance, determine whether the number of defects and the company supplying materials are related (dependent). Analysis of Material Suppliers and Defects Company #1 Company #2 Company #3 Totals fo fo fo fo f. High defects 6 9 15 30 Low defects 14 11 5 30 Totals 20 20 20 60 IV. Four people were given extensive sales training. Test whether their sales performance improved Analysis of Sales Training using a .05 level of significance. Assume normally Effectiveness distributed populations with unknown standard Salesperson Sales deviations. Performance Before After A 12 15 B 13 17 C 10 14 D 11 12 TotalsV. Owners of the Quick Chow Restaurant are concerned about the average time to serve Data set for those using customers at two of their stores. A sample of 32 customers at store A resulted in a mean statistics software service time of 80 seconds and a standard deviation of 8 seconds. A sample of 49 customers at store B resulted in a mean service time of 75 seconds and a standard Store A Store B deviation of 7 seconds. Test at the .02 level of significance whether the mean time to 66 72 79 81 wait on customers at these two stores is the same. 84 73 74 84 70 86 83 68 84 77 85 65 78 72 74 78 83 85 71 63 71 83 88 77 72 90 74 64 87 86 77 62 68 87 85 75 98 73 83 74 78 84 80 78 80 83 70 62 75 93 78 80 72 75 86 69 93 82 71 76 66 74 83 68 80 81 82 82 70 75 64 71 68 78 78 66 75 VI. Before recent improvements, it took 36.4 minutes to assemble a part. Data set for those using After improvements, a sample of 16 had an average assembly time statistics software of 34 minutes. The sample standard deviation was 2.4 minutes. Test at the .01 level of significance whether improvements lowered Time After Improvements assembly time. 35.9 31.8 31.5 36.6 30.8 32.3 32.0 36.2 35.8 35.7 36.8 36.4 32.6 36.8 31.3 31.5
Step by Step Solution
There are 3 Steps involved in it

Get step-by-step solutions from verified subject matter experts