

Question: please take your time to solve it and outline the equation and steps you used. Thank you 6.9. The following 32 days of data represent
please take your time to solve it and outline the equation and steps you used. Thank you 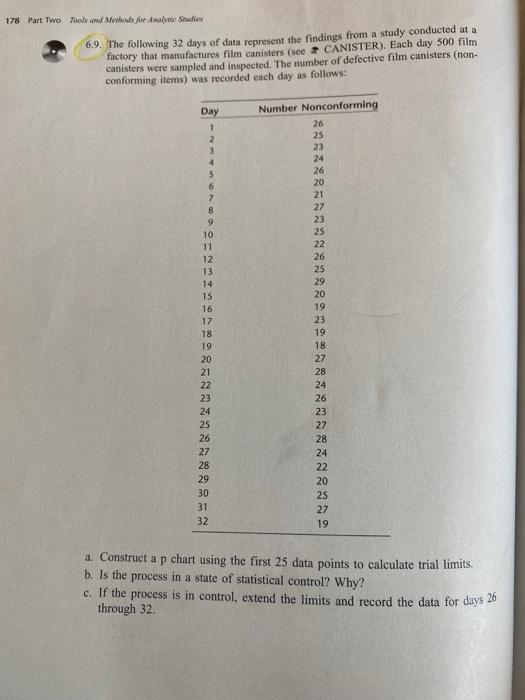
6.9. The following 32 days of data represent the findings from a study conducted at a fictory that manufactures film canisters (see - CANISTER). Each day 500 film canisters were sampled and inspected. The number of defective film canisters (nonconforming items) was recorded each day as follows: a. Construct a p chart using the first 25 data points to calculate trial limits. b. Is the process in a state of statistical control? Why? c. If the process is in control, extend the limits and record the data for days 26 through 32. 6.9. The following 32 days of data represent the findings from a study conducted at a fictory that manufactures film canisters (see - CANISTER). Each day 500 film canisters were sampled and inspected. The number of defective film canisters (nonconforming items) was recorded each day as follows: a. Construct a p chart using the first 25 data points to calculate trial limits. b. Is the process in a state of statistical control? Why? c. If the process is in control, extend the limits and record the data for days 26 through 32 Step by Step Solution
There are 3 Steps involved in it
1 Expert Approved Answer
Step: 1 Unlock

Question Has Been Solved by an Expert!
Get step-by-step solutions from verified subject matter experts
Step: 2 Unlock
Step: 3 Unlock