

Question: please this is the link to the data set on excel (https://sg.docworkspace.com/d/sAMoJ6Br3zeuSAe7Ft8yvpxQ) please copy and paste this link on your browser. Kindly solve this for
please this is the link to the data set on excel (https://sg.docworkspace.com/d/sAMoJ6Br3zeuSAe7Ft8yvpxQ) please copy and paste this link on your browser.
Kindly solve this for me and afterwards copy the link of the solved excel file and paste it on the answer section. please do not list out what i should do because that wont help me on this, rather solved it for me and share the excel file link on the anwer sections and that will help a lot. thank you.
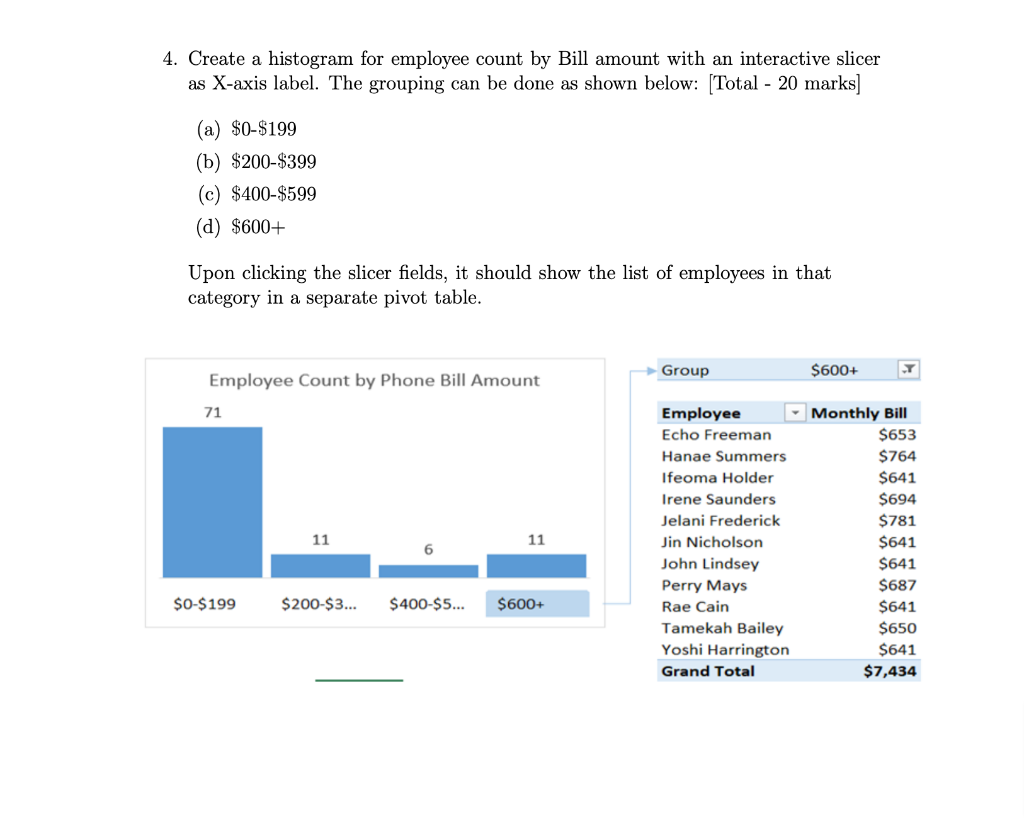
4. Create a histogram for employee count by Bill amount with an interactive slicer as X-axis label. The grouping can be done as shown below: [Total - 20 marks] (a) $0$199 (b) $200$399 (c) $400$599 (d) $600+ Upon clicking the slicer fields, it should show the list of employees in that category in a separate pivot table
Step by Step Solution
There are 3 Steps involved in it

Get step-by-step solutions from verified subject matter experts